-1

I have data of the following form.

id       t1         t2           t3          t4          t5         t6
1   0.04121212  0.06666667  0.60484848  0.16484848  0.03030303  0.09212121  
2   0.41570881  0.09961686  0.09961686  0.15134100  0.11685824  0.11685824  
3   0.09195402  0.58160920  0.07816092  0.07126437  0.08505747  0.09195402  
4   0.14901961  0.35490196  0.11372549  0.10196078  0.16666667  0.11372549  
5   0.09236948  0.12248996  0.09839357  0.09839357  0.50803213  0.08032129  

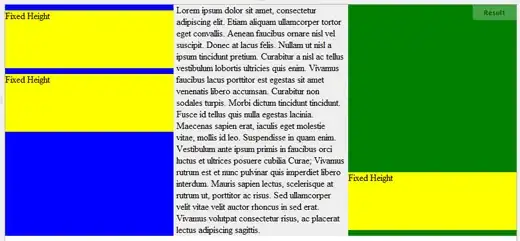
I want to plot this on the same histogram (see below for the kind of histogram I need).

enter image description here

Any help is highly appreciated. Thanks!
iGada
  • 599
  • 3
  • 9
  • Does this answer your question? [R- split histogram according to factor level](https://stackoverflow.com/questions/34044725/r-split-histogram-according-to-factor-level) – cdcarrion Sep 10 '20 at 22:00
  • It's a bit different from what you suggested. – iGada Sep 10 '20 at 22:05

1 Answers1

1

Do you want a histogram or a stacked bar plot. Something like this?

library(ggplot2)
df %>%
  tidyr::pivot_longer(cols = -id) %>%
  ggplot() + aes(id, value, fill = name) + geom_bar(stat = "identity")

enter image description here

Ronak Shah
  • 377,200
  • 20
  • 156
  • 213