0

I made a simple code to find the contour of an object in an image.

    img = cv2.imread(file_path, cv2.IMREAD_GRAYSCALE)

    blur = cv2.GaussianBlur(img_enhanced,(25,25),0) # apply blur for contour
    ret, binary = cv2.threshold(blur,1,255,cv2.THRESH_BINARY) # apply threshold to blur image

    contours, hierarchy = cv2.findContours(binary, cv2.RETR_EXTERNAL, cv2.CHAIN_APPROX_SIMPLE) # find countour
    obj_index = contours.index(max(contours, key=len)) # find index of largest object
    contour_img = cv2.drawContours(img, contours, obj_index, (0,255,0), 3) # draw coutour on original image

    plt.imshow(contour_img)
    plt.show()

The original image is already grayscale but anyway I applied cv2.IMREAD_GRAYSCALE when I import the image.

And I thought if I apply the grayscale image when I 'Draw' contour, with below syntax,

contour_img = cv2.drawContours(img, contours, obj_index, (0,255,0), 3)

I can have a grayscale image with colored contour, but it shows weird colored image.

How can I draw a colored contour line on the grayscale image?

Thanks in advance

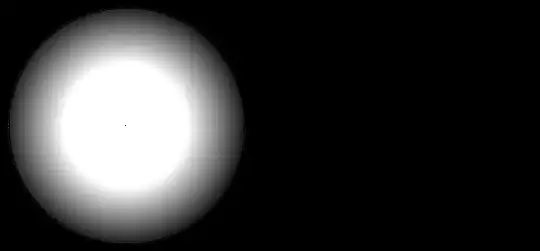
image sample: black background and white object

enter image description here

Dong-gyun Kim
  • 411
  • 5
  • 23
  • Can you post the image( weird colored image) ? Are you getting yellow,violet colour? – Pygirl Sep 22 '20 at 11:29
  • @Pygirl Oh. yes. exactly. – Dong-gyun Kim Sep 22 '20 at 11:30
  • actually when you plot them using matplotlib for a greyscale it will show you (violet-> black, yellow--> white) use this: `plt.show(contour_img, cmap='gray)` – Pygirl Sep 22 '20 at 11:31
  • Btw you can't plot coloured line to the greyscale image. Because see, for coloured image there will rgb component. but your grayscale image doesn't have. So I will advice you to use 2 images. Open the image as it is (check its shape, it will give you channel 3 or 4) this will be your img1, img2 will be greyscale(converted) of the img1. Use img2 for getting contours and img1 for drawing on them. – Pygirl Sep 22 '20 at 11:35
  • @Pygirl Yeah that's what I want. But HOW? – Dong-gyun Kim Sep 22 '20 at 11:47
  • Hope my answer helps. Just try changing the range of threshold. I will suggest you to always check your binarized image. https://stackoverflow.com/a/42434377/6660373 – Pygirl Sep 22 '20 at 12:21

1 Answers1

1

Based on my comment:

Try something like this and tell me if it works or not

Edit: I have changed the threshold range. cv2.threshold(blur,25,255,cv2.THRESH_BINARY)

img = cv2.imread(file_path, 1) 
print(img.shape) # this should give you (img_h, img_w, 3)
img2 = cv2.cvtColor(img, cv2.COLOR_BGR2GRAY)

blur = cv2.GaussianBlur(img2,(25,25),0) # apply blur for contour
ret, binary = cv2.threshold(blur,25,255,cv2.THRESH_BINARY) # apply threshold to blur image

contours, hierarchy = cv2.findContours(binary, cv2.RETR_EXTERNAL, cv2.CHAIN_APPROX_SIMPLE) # find countour
obj_index = contours.index(max(contours, key=len)) # find index of largest object
contour_img = cv2.drawContours(img, contours, obj_index, (0,255,0), 3) # draw coutour on original image

plt.imshow(contour_img, cmap='gray')
plt.show()

enter image description here


plt.hist(blur.ravel(), bins=50)

enter image description here


Pygirl
  • 12,969
  • 5
  • 30
  • 43
  • colored line 'is' on the gray image, but the contour line is always the outline of the whole image, not the object. but before it detected the object. – Dong-gyun Kim Sep 22 '20 at 11:55
  • more or less looks like the image above. Black background and white object – Dong-gyun Kim Sep 22 '20 at 12:09
  • Actually your code is not able to capture the contour in the first place. It's not binarized correctly. – Pygirl Sep 22 '20 at 12:12
  • Check my edited answer. Range was not okay. you can plot histogram to see the pixel frequency to determine the threshold value. `plt.hist(blur.ravel())` – Pygirl Sep 22 '20 at 12:17