I'd like to make a function that creates histograms across a number of dimensions and numeric variables.
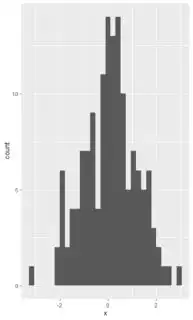
I'm trying to do it, except that the x-axis takes on the values for whatever the final loop was. So, when the final loop had an x-axis that expanded from 0 to 5000, then all of the histograms would have that same x axis no matter what.
This is my code
  groups_df <-
    data.frame(
      groups =
          c(rep("ABC", 3),
          rep("XYZ", 2)),
      cuts =
          c(c("cat", "dog", "bird"),
            c("red", "blue")) %>%
    mutate(groups = as.character(groups),
           cuts = as.character(cuts))

  numeric.variables <-
    c("hops",
      "skips",
      "jumps")

  visualizations <- list()

  for (i in seq_along(groups_df$groups)){

    for (j in seq_along(numeric.variables)){

      visualizations[[groups_df$groups[i]]][[str_replace_all(tolower(groups_df$cuts[i]), " ", "_")]][[numeric.variables[j]]] <-
        mydf %>%
        filter(get(groups_df$groups[i]) == list.of.groups_df$cuts[i]) %>%
        ggplot(aes(get(numeric.variables[j]))) +
        geom_histogram() +
        labs(x = numeric.variables[j],
             title = paste0(str_replace_all(numeric.variables[j], "_", " "), " - ", tolower(groups_df$cuts[i])))

    }
  }

