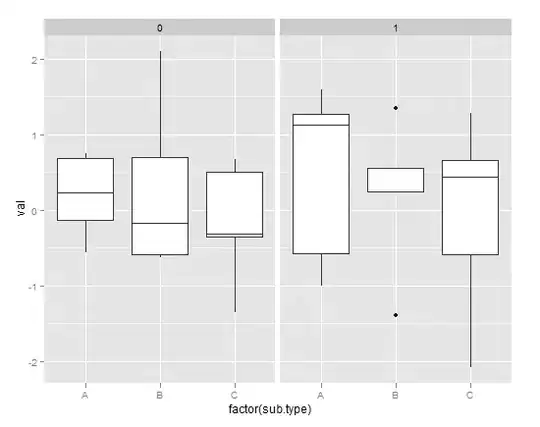
I don't know why everytime when i plot with seaborn it's always showing all the date object as below.
I have already checked my "join_date" is an object rather than datetime.
Do anyone know what's the problem and how can I fix it?
Asked
Active
Viewed 549 times
1 Answers
1
One solution could be that you can modify the datetime object before plotting using to_period method. Here is an example:
import pandas as pd
import seaborn as sns
import matplotlib.pyplot as plt

#generating some test data
days = pd.date_range('1/1/2000', periods=8, freq='D')
d2 = dict({'price': [10, 11, 9, 13, 14, 18, 17, 19]})
df = pd.DataFrame(d2,index=days)
print(df)

#making join_date a datetime object
#df['join_date'] = pd.to_datetime(df['join_date'])

#setting join_date as index of the dataframe
#df.set_index(['join_date'],inplace=True)

#reducing the datetime object assuming the datetime is index and it is in pandas datetime format
df.index = df.index.to_period("D")

#plotting the heatmap
sns.heatmap(data=df)
plt.tight_layout()
plt.show()
Original Outout:
Final Outout after using to_period:
Grayrigel
- 3,474
- 5
- 14
- 32
-
added an answer. Let me know if it works for you. If it does please consider accepting the upvoting the answer. – Grayrigel Oct 06 '20 at 12:40
-
Thanks for your help! But i found a direct ans~ Apparently Date object is changed to a Datetime Index during the process, so all you have to do is just changing the Datetime Index back to str. You can check the type of pivot table index as type(df.index) afterwards you change the index type with df.index.astype(str) – Tinky Oct 07 '20 at 01:42
-
Thanks. Yes. that is a good solution. However, there are plenty of advantages of keep datetime index if you are working with timeseries analysis. For example, you can aggregate the results and plot it montly, quarterly, yearly. Filter dataframe based on time. So, you might wanna consider keep it in datetime format if you intend to do some more analysis. – Grayrigel Oct 07 '20 at 07:39


