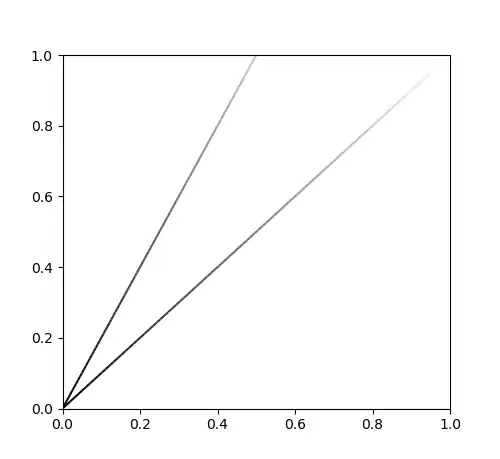
I am trying to color lines with a colormap so that the gradient color indicates the length of the line. My current program colors lines, depending on where they are on the x-axis.
All variables ending with _2 belong to the diagonal line.
import numpy as np
import matplotlib.pyplot as plt
from matplotlib.collections import LineCollection
from matplotlib.colors import LinearSegmentedColormap

x_nom = [0, 1]
y_nom = [0, 1]

# x,y coordinates
x1 = 0
x2 = 0.5
y1 = 0
y2 = 1

x1_2 = 0
x2_2 = 1
y1_2 = 0
y2_2 = 1

# create segments from coordinates
x_coords = np.linspace(x1, x2, 100)
y_coords = np.linspace(y1, y2, 100)

x_coords_2 = np.linspace(x1_2, x2_2, 100)
y_coords_2 = np.linspace(y1_2, y2_2, 100)

# "resolution"
res_ar = np.linspace(x1, x2, len(x_coords))
res_ar_2 = np.linspace(x1_2, x2_2, len(x_coords_2))

# reshape array to fit matplotlib segmentation
points = np.array([x_coords, y_coords]).T.reshape(-1, 1, 2)
points_2 = np.array([x_coords_2, y_coords_2]).T.reshape(-1, 1, 2)
segments = np.concatenate([points[:-1], points[1:]], axis=1)
segments_2 = np.concatenate([points_2[:-1], points_2[1:]], axis=1)

fig, ax = plt.subplots(figsize=(5,5))

# create custom colormap
cvals = [0., 1.]
colors = ['black', 'white']
norm = plt.Normalize(min(cvals), max(cvals))
tuples = list(zip(map(norm, cvals), colors))
cmap = LinearSegmentedColormap.from_list('', tuples)

# plot segmented line
lc = LineCollection(segments, cmap=cmap, norm=norm)
lc_2 = LineCollection(segments_2, cmap=cmap, norm=norm)
lc.set_array((res_ar))
lc_2.set_array((res_ar_2))
ax.add_collection(lc)
ax.add_collection(lc_2)
plt.show()
As you can see, the diagonal line is plotted in the full colormap (color regions 0 to 1). It has a length of 1.41 (square root of x=1 and y=1). The upper line has a length of 1.12 (x=0.5, y=1). The upper line is about 0.8 times as long as the diagonal line. How would I use the colormap to color the line in region 0 to 0.8 instead of (as of now) 0 to 0.5?
Edit:
Thanks to tmdavison I was able to work it out. This code colors the line, depending on its length:
import numpy as np
import matplotlib.pyplot as plt
from matplotlib.collections import LineCollection
from matplotlib.colors import LinearSegmentedColormap

x_nom = [0, 1]
y_nom = [0, 1]

# x,y coordinates
x1 = 0
x2 = 0.8
y1 = 0
y2 = 1

x1_2 = 0
x2_2 = 1
y1_2 = 0
y2_2 = 1

# create segments from coordinates
x_coords = np.linspace(x1, x2, 100)
y_coords = np.linspace(y1, y2, 100)

x_coords_2 = np.linspace(x1_2, x2_2, 100)
y_coords_2 = np.linspace(y1_2, y2_2, 100)

l_nom = np.sqrt(x_nom[1]**2 + y_nom[1]**2)
l = np.sqrt(x2**2 + y2**2)
correct = l/l_nom

# "resolution"
res_ar = np.linspace(x1, x2, len(x_coords)) * correct/x2
res_ar_2 = np.linspace(x1_2, x2_2, len(x_coords_2))

# reshape array to fit matplotlib segmentation
points = np.array([x_coords, y_coords]).T.reshape(-1, 1, 2)
points_2 = np.array([x_coords_2, y_coords_2]).T.reshape(-1, 1, 2)
segments = np.concatenate([points[:-1], points[1:]], axis=1)
segments_2 = np.concatenate([points_2[:-1], points_2[1:]], axis=1)

fig, ax = plt.subplots(figsize=(5,5))

# create custom colormap
cvals = [0., 1.]
colors = ['black', 'white']
norm = plt.Normalize(min(cvals), max(cvals))
tuples = list(zip(map(norm, cvals), colors))
cmap = LinearSegmentedColormap.from_list('', tuples)

# plot segmented line
lc = LineCollection(segments, cmap=cmap, norm=norm)
lc_2 = LineCollection(segments_2, cmap=cmap, norm=norm)
lc.set_array((res_ar))
lc_2.set_array((res_ar_2))
ax.add_collection(lc)
ax.add_collection(lc_2)
plt.show()


