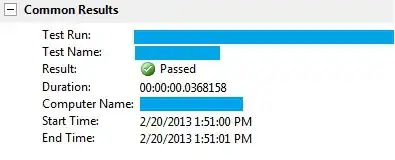
I have been attempting this for a while now and can't find any appropriate information, thanks.
Asked
Active
Viewed 29 times
-4
Ronak Shah
- 377,200
- 20
- 156
- 213
Port_Zye
- 25
- 6
-
3Please do not post images . Kindly refer to https://meta.stackoverflow.com/questions/285551/why-not-upload-images-of-code-errors-when-asking-a-question/285557#285557 – sk8 Oct 12 '20 at 05:00
1 Answers
1
library(plotly)

barplot <- plot_ly(
data = data,
  x = ~weight.Category,
  y = ~Percent.of.Adults,
  name = "bar plot",
  type = "bar"
)

barplot
sk8
- 170
- 1
- 9
