0

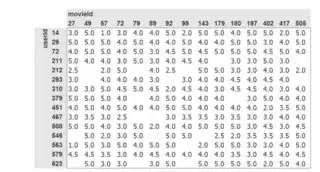
In setup for a collaborative filtering model on the MovieLens100k dataset in a Jupyter notebook, I'd like to show a dense crosstab of users vs movies. I figure the best way to do this is to show the most frequent n user against the most frequent m movie.

If you'd like to run it in a notebook, you should be able to copy/paste this after installing the fastai2 dependencies (it exports pandas among other internal libraries)

from fastai2.collab import *
from fastai2.tabular.all import *
path = untar_data(URLs.ML_100k)

# load the ratings from csv
ratings = pd.read_csv(path/'u.data', delimiter='\t', header=None,
                      names=['user','movie','rating','timestamp'])
# show a sample of the format
ratings.head(10)

# slice the most frequent n=20 users and movies
most_frequent_users = list(ratings.user.value_counts()[:20])
most_rated_movies = list(ratings.movie.value_counts()[:20])
denser_ratings = ratings[ratings.user.isin(most_frequent_users)]
denser_movies = ratings[ratings.movie.isin(most_rated_movies)]

# crosstab the most frequent users and movies, showing the ratings
pd.crosstab(denser_ratings.user, denser_movies.movie, values=ratings.rating, aggfunc='mean').fillna('-')

Results: Code results crosstab

Expected: Desired crosstab

The desired output is much denser than what I've done. My example seems to be a little bit better than random, but not by much. I have two hypothesis to why it's not as dense as I want:

  • The most frequent users might not always rate the most rated movies.
  • My code has a bug which is making it index into the dataframe incorrectly for what I think I'm doing

Please let me know if you see an error in how I'm selecting the most frequent users and movies, or grabbing the matches with isin.

If that is correct (or really, regardless) - I'd like to see how I would make a denser set of users and movies to crosstab. The next approach I've thought of is to grab the most frequent movies, and select the most frequent users from that dataframe instead of the global dataset. But I'm unsure how I'd do that- between searching for the most frequent user across all the top m movies, or somehow more generally finding the set of n*m most-linked users and movies.

I will post my code if I solve it before better answers arrive.

user
  • 3,388
  • 7
  • 33
  • 67
  • Please provide copy/pasteable sample input data as well as output data (no images). Please see: https://stackoverflow.com/questions/20109391/how-to-make-good-reproducible-pandas-examples – David Erickson Oct 13 '20 at 23:08
  • @DavidErickson This is loosely related to the MovieLens100k dataset, but I'm not totally sure how I would slice up a properly representative version of that to avoid an import. Is there a way I can have pandas output a sample of 100 entries in a format that I could copy and paste back into pandas? I'll do that if I can. Until then, the code above will copy/paste with the exception of requiring a `pip install fastai2` – user Oct 16 '20 at 09:08

1 Answers1

0

My code has a bug which is making it index into the dataframe incorrectly for what I think I'm doing

True, there is a bug.

most_frequent_users = list(ratings.user.value_counts()[:20])
most_rated_movies = list(ratings.movie.value_counts()[:20])

actually is grabbing the value counts. So if users 1, 2, and 3 made 100 reviews each, the above code would return [100, 100, 100] when really we wanted the ids [1,2,3]. To get the id of the most frequent entries instead of the tally, you'd add .index to value_counts

most_frequent_users = list(ratings.user.value_counts().index[:20])
most_rated_movies = list(ratings.movie.value_counts().index[:20])

This alone improves the density to almost what the final result is below. What I was doing before was actually just a random sample (erroneously using value totals as the lookup for a movie id)

Furthermore, the approach I mentioned at the end of the post is a more robust general solution for crosstabbing with highest density as the goal. Find the most frequent X, and within that specific set, find the most frequent Y. This will work well even in sparse datasets.

n_users = 10
n_movies = 20

# list the ids of the most frequent users (those who rated the most movies)
most_frequent_users = list(ratings.user.value_counts().index[:n_users])
# grab all the ratings made by these most frequent users
denser_users = ratings[ratings.user.isin(most_frequent_users)]

# list the ids of the most frequent movies within this group of users
dense_users_most_rated = list(denser_ratings.movie.value_counts().index[:n_movies])
# grab all the most frequent movies rated by the most frequent users
denser_movies = ratings[ratings.movie.isin(dense_users_most_rated)]

# plot the crosstab
pd.crosstab(denser_users.user, denser_movies.movie, values=ratings.rating, aggfunc='mean').fillna('-')

This is exactly what I was looking for.

Dense crosstab

Only questions remaining are how standard was this approach? And why are some values floats?

user
  • 3,388
  • 7
  • 33
  • 67