What I want is very similar to the plot in this thread:
What I would like to have extra is:
- x,y,z dimension can be different. For example, x=[0,1,2,3], y=[200,300,400], z=[1000,2000,3000]
(edit:
- x,y,z can be different in both dimension and units. For example, x=[0,1], y=[200,300,400], z=[1000,2000,3000,4000])
- If it can allow me to add labels to XYZ axis, that would be perfect. (It is more of a extra requirement as I can manually edit the exported svg)
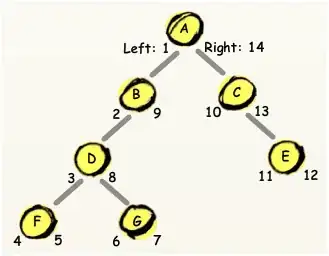
Effectively, what I want is like this:

I found something close to what I want in another post:

It uses the function Poly3DCollection. But I could not figure out how to select the elements such as surface x==0, the line (x==0) and (y==2). Nor do can I figure out how to change the label.
