I'm trying to find correlations between 8 characteristics describing an observational data set. I chose to use SciPy's implementation of orthogonal distance regression because it can handle errors in both variables. The issue is that not all of these characteristics have errors associated with their values, and with the exception of a very few combinations there is no theoretical basis predicting how or even if these characteristics are related. Discovering this latter information is in fact a key point in my research. I have encountered issues and I need to know if the issue is with my implementation or if there is a deeper problem.
First, I will post some code from my implementation so that I can reference it. This is not a minimum working example; this is perhaps the most complicated code I've yet created and I don't know how to pare it down into something reasonable, but it should give you an idea as to how I've implemented ODR.
import numpy as np
import matplotlib.pyplot as plt
from scipy.odr import ODR, Model, Data, RealData
%matplotlib notebook

# Define a linear function to fit.
def linear_func(C, x):
    return C[0] * x + C[1]

# Now we need to determine the actual correlations.  Loop over the combinations and find the functional form of the
# correlation.
for keys in key_list:

    ### SORT DATA ###

    # Create an array to hold the data for this combination of characteristics.
    data_array = np.ones((n_rows, 4))

    # Determine the first columns for both characteristics.
    a = first_column_dict[keys[0]]
    b = first_column_dict[keys[1]]

    # Put the raw data for the two characteristics into their proper place.
    data_array[:, 0] = sample_data[:, a]
    data_array[:, 2] = sample_data[:, b]

    # Now fill in the weights (if such exist).  We will need to find an "average" error if there are unequal errors.
    # Start with the first characteristic.
    if (keys[0] in one_error_list) == True:
        data_array[:, 1] = sample_data[:, a + 1]
    elif (keys[0] in two_error_list) == True:
        data_array[:, 1] = (sample_data[:, a + 1] + sample_data[:, a + 2]) / 2

    # Now do the same with the second characteristic.
    if (keys[1] in one_error_list) == True:
        data_array[:, 3] = sample_data[:, b + 1]
    elif (keys[1] in two_error_list) == True:
        data_array[:, 3] = (sample_data[:, b + 1] + sample_data[:, b + 2]) / 2

    # Define a mask to remove rows with values of NaN.
    mask = ~np.isnan(data_array[:, 0]) & ~np.isnan(data_array[:, 2])

    ### DETERMINE CORRELATIONS ###

    # Define the data being fit.
    data = RealData(data_array[mask][:, 0], data_array[mask][:, 2], sx=data_array[mask][:, 1], sy=data_array[mask][:, 3])

    # Define the model being fit.
    model = Model(linear_func)

    # Define the ODR that will be used to fit the data.
    odr_obj = ODR(data, model, beta0=[1, 0])
    odr_obj.set_job(fit_type=0, deriv=0)

    # Run the model.
    fit = odr_obj.run()
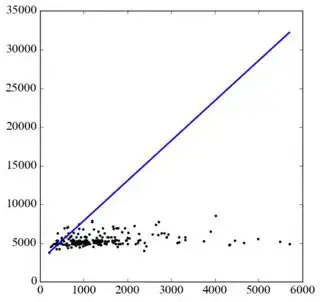
I'm only trying to find equations of fit for characteristic pairs that I have determined (using Spearman's rank correlation coefficient) have correlations. Sometimes, the fits that ODR finds are sometimes patently absurd, and this depends on how I set up my code to run ODR. One example is a pair of characteristics in which the x-axis variable has errors associated with it but the y-axis variable doesn't. I feed the known x-variable errors and set a value of 1 for the y-variable; going by the documentation, this should set the weights for the y-variable to 1 and, given the errors in the x-variable, a very small weight to the x-variable. I suspect this may be the cause of the issue, but I don't know how to solve it. Here is a graph of the data with the fit as I've just described:
This clearly doesn't make sense; the fit is not at all correct. If I set all weights to 1 on both axes however, I obtain the following correlation plot:
This is a much better fit, but it ignores the errors that were one reason I chose ODR in the first place! If I set the fit_type to 2 in the set_job command, forcing the program to do an ordinary least squares fit, I get a different looking fit similar to the second:
This again looks like a good fit, but I don't know if it's better or more accurate than my second result. Which one do I trust more? Worse yet, not all of the characteristics follow this trend of improved accuracy when removing the errors. Some fits only make sense when I fully include the errors as in the first example. And not all characteristics are related linearly, as some are obviously related logarithmically.
I have two questions about this. Should I be using ODR at all, or is there a more appropriate routine to use when trying to determine these correlations? Is my implementation of defining the error correct, particularly in the cases in which one of the characteristics doesn't have an associated error?


