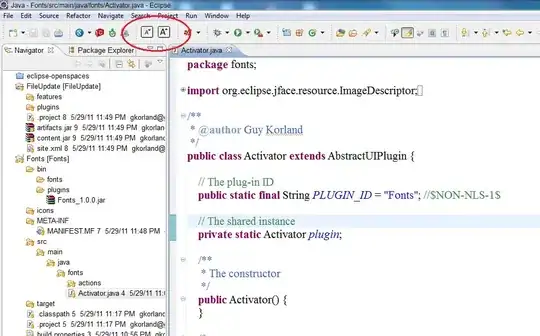
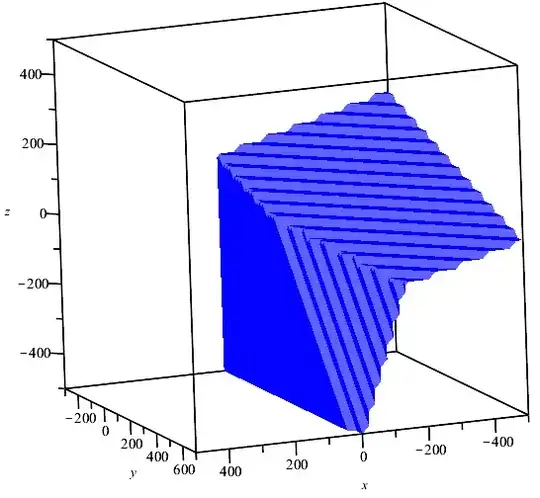
This is my code and the result I get, the ylim isn't in the form I want!!! 
Asked
Active
Viewed 164 times
0
JohanC
- 71,591
- 8
- 33
- 66
Mohammad Peighambari
- 37
- 6
-
`ax = sns.regplot(...)` and `ax.ticklabel_format(useOffset=False, style='plain')` should work – JohanC Oct 26 '20 at 10:13
1 Answers
0
Try the following:
ax = sns.regplot('sqft_above', 'price', data=df)
ax.ticklabel_format(style='plain')
This will set the "style" of the tick labels to be plain, removing the scientific formatting.
tania
- 2,104
- 10
- 18
