0

I've been trying to make my annotations avoid the plot area and get drawn completely outside, using AdjustText so they don't overlap. I haven't found any solution or hidden parameter in the matplotlib or AdjustText docs so far to do this. What am I missing? All I found were ways to clip the annotations

import matplotlib.pyplot as plt
from matplotlib.widgets import CheckButtons
from adjustText import adjust_text
x_axis1 = [0.0, 0.5, 1.0, 1.5, 2.0, 2.5, 5.5, 6.0, 10.5, 15.0, 15.5]
y_axis1 = [60.0, 80.0, 70.0, 60.0, 70.0, 50.0, 80.0, 100.0, 80.0, 60.0, 50.0]
x_axis2 = [0.0, 0.3, 0.6, 0.9]
y_axis2_labels = ['First Station', 'Second Station', 'Third Station', 'Last station']
max_y = max(y_axis1)
fig, ax = plt.subplots()

ax.set_xlabel("Distance [km]")
ax.set_ylabel("Speed [km/h]")
l0, = ax.step(x_axis1, y_axis1, label="Speed", where="post")

ax2 = ax.twiny()
ax2.set_xlim(ax.get_xlim())
ax2.set_label('Stations')
plt.xticks([])

ax2.tick_params(
    axis="x",
    which='major',
    direction="in",
    width=1.5,
    length=7,
    labelsize=10,
    color="red",
)

for x in x_axis2:
    ax2.axvline(x, color='red', ls=':', lw=1.5)

# -------------------

y_axis2 = [max(ax.get_ylim()) for i in range(len(x_axis2))]
texts = [
    plt.text(
        x_axis2[i],
        y_axis2[i],
        y_axis2_labels[i],
        ha='center',
        va='center',
        # annotation_clip=False,
        rotation=20,
        clip_on=False
    ) for i in range(len(x_axis2))
]

adjust_text(
    texts,
    [ax.get_xlim()],
    [ax.get_ylim()],
    arrowprops=dict(
        arrowstyle='->',
        connectionstyle="arc,angleA=-90,angleB=0,armA=30,armB=30,rad=5",
        color='red'
    ),
)
# -------------------

lines = [l0, ax2]
rax = plt.axes([0, 0, 0.12, 0.1])
labels = [str(line.get_label()) for line in lines]
visibility = [line.get_visible() for line in lines]
check = CheckButtons(rax, labels, visibility)


def func(label):
    index = labels.index(label)
    lines[index].set_visible(not lines[index].get_visible())
    plt.draw()


check.on_clicked(func)

fig.tight_layout()

plt.show()

This is the current output I get:
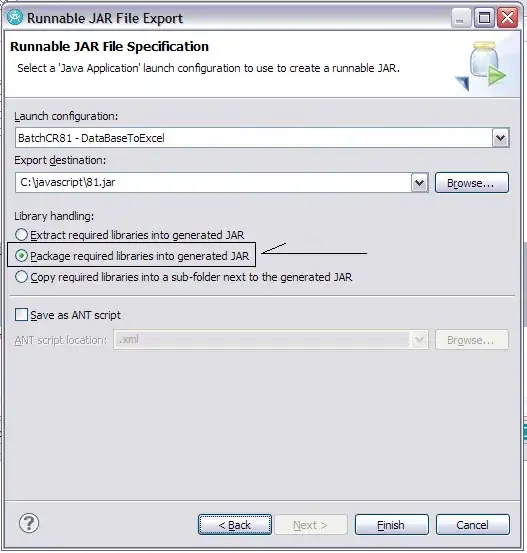
enter image description here

LittleFoxyFox
  • 135
  • 1
  • 1
  • 11
  • You can use `transform=ax.transAxes` in `plt.text` to enable input in terms of `axis-coords` in the range [0,1]. Even though not described in the documentation, you also specify values outside of this range and the text will be placed there. I don't know if it will work together with AdjustText – Timo Nov 19 '20 at 15:56

1 Answers1

0

Unfortunately AdjustText moves everything inside the limits by default. I ended up adjusting the code in Matplotlib overlapping annotations / text and messing with some obscure matplotlib parameters:

import matplotlib.pyplot as plt
import numpy as np


def get_text_positions(x_data, y_data, txt_width, txt_height):
    """Get plot tick labels to check for collision."""
    a = list(zip(y_data, x_data))
    text_positions = y_data.copy()
    for index, (y, x) in reversed(list(enumerate(a))):
        local_text_positions = [
            i for i in a
            if i[0] > (y - txt_height) and (abs(i[1] - x) < txt_width * 2) and i != (y, x)
        ]
        if local_text_positions:
            sorted_ltp = sorted(local_text_positions)
            if abs(sorted_ltp[0][0] - y) < txt_height:  #True == collision
                differ = np.diff(sorted_ltp, axis=0)

                a[index] = (sorted_ltp[-1][0] + txt_height, a[index][1])
                text_positions[index] = sorted_ltp[-1][0] + txt_height * 2
                for k, (j, m) in enumerate(differ):
                    #j is the vertical distance between words
                    if j > txt_height * 2:  #if True then room to fit a word in
                        a[index] = (sorted_ltp[k][0] + txt_height, a[index][1])
                        text_positions[index] = sorted_ltp[k][0] + txt_height
                        break

    return text_positions


def text_plotter(x_data, y_data, y_heigth, text_positions, axis, txt_width, txt_height):
    """Changes label text location and adds arrow if there's a collision."""
    for x, y, h, t in list(zip(x_data, y_data, y_heigth, text_positions)):
        axis.text(
            x - txt_width,
            1.02 * t,
            str(y),
            rotation=70,
            color='blue',
            clip_on=False,
        )
        if h != t:
            axis.arrow(
                x,
                t,
                0,
                h - t,
                color='black',
                alpha=0.2,
                width=txt_width * 0.1,
                head_width=txt_width / 2,
                head_length=txt_height * 0.3,
                zorder=0,
                length_includes_head=True,
                clip_on=False,
            )


x_axis1 = [0.0, 0.5, 1.0, 1.5, 2.0, 2.5, 5.5, 6.0, 10.5, 15.0, 15.5]
y_axis1 = [60.0, 80.0, 70.0, 60.0, 70.0, 50.0, 80.0, 100.0, 80.0, 60.0, 50.0]
x_axis2 = [0, 0.2, 0.3, 1.2, 1.5, 1.8, 2, 3, 4, 5, 5.5, 6, 7, 7.5, 8, 9, 10, 13, 15]
y_axis2 = [
    'Station 1', 'Station 2', 'Station 3', 'Station 4', 'Station 5', 'Station 6', 'Station 7',
    'Station 8', 'Station 9', 'Station 10', 'Station 11', 'Station 12', 'Station 13', 'Station 14',
    'Station 15', 'Station 16', 'Station 17', 'Station 18', 'Station 19'
]

fig, ax = plt.subplots()

ax.set_xlabel("Distance [km]")
ax.set_ylabel("Speed [km/h]")
l0, = ax.step(x_axis1, y_axis1, label="Speed", where="post")

ax2 = ax.twiny()
ax2.set_xlim(ax.get_xlim())
ax2.set_label('Stations')
txt_height = 0.35 * (plt.ylim()[1] - plt.ylim()[0])
txt_width = 0.01 * (plt.xlim()[1] - plt.xlim()[0])

y_height = [max(ax.get_ylim())] * len(x_axis2)  # labels on spines
x_data = [i / max(x_axis1) for i in x_axis1]

text_positions = get_text_positions(x_axis2, y_height, txt_width, txt_height)
text_plotter(x_axis2, y_axis2, y_height, text_positions, ax, txt_width, txt_height)

plt.ylim(0, max(y_height))  #+ 2 * txt_height

plt.xticks([])
plt.subplots_adjust(top=0.5)  # manual adjustment

plt.show()

which outputs:

enter image description here

LittleFoxyFox
  • 135
  • 1
  • 1
  • 11