0

I'm trying to plot the decision boundary of a classifier. I'm getting weird interpolation artefacts at the edges of each boundary.

This is what I'm getting:

This is what the raw data of the classifier output is:

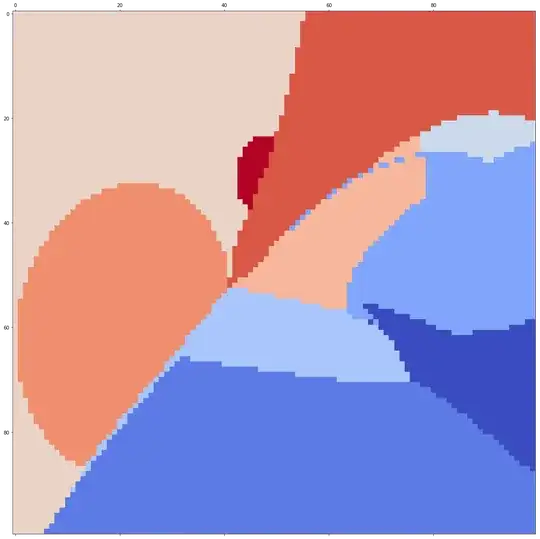
Any ideas what's causing this?

Thanks.

Zhubei Federer
  • 1,274
  • 2
  • 10
  • 27
  • 1
    Can you try this? https://hackernoon.com/how-to-plot-a-decision-boundary-for-machine-learning-algorithms-in-python-3o1n3w07 – mhhabib Nov 23 '20 at 02:39
  • @MHHabib That interesting article shows the same artifacts when there are more than 2 values (e.g. the iris dataset). This is an artifact of how a contour plot interpolates between the values: between level 1 and level 3, the contour plot will "find" a contour of level 2. There isn't really a workaround when using a contour plot, apart from using a much finer grid on which to calculate the values. See e.g. [Graph k-NN decision boundaries](https://stackoverflow.com/questions/45075638/graph-k-nn-decision-boundaries-in-matplotlib) for an approach with `pcolormesh` (also needs a fine grid). – JohanC Nov 23 '20 at 06:56

0 Answers0