0

I have a data set that is shaped like below.

import pandas as pd

catalog=pd.read_table("Catalog/MainshockCatalog.txt", sep="\t", 
                  names=["Year", "Month", "Day", "Hour", "Min", "Sec", "Lat",
                        "Lon", "Depth", "Mag"])
catalog

catalog dataframe

I drew the map of each event using Axes3D and the coordinate was given as columns Lat, Lon, and Depth of catalog DataFrame.

import matplotlib.pyplot as plt
from mpl_toolkits.mplot3d import Axes3D

fig=plt.figure(figsize=(30, 20))
ax=fig.add_subplot(111, projection='3d')

x=catalog["Lat"]
y=catalog["Lon"]
z=-catalog["Depth"]

ax.scatter(x, y, z, c='k', marker='o', s=50, alpha=0.1, facecolors='none')
ax.scatter(x[0], y[0], z[0], c='b', marker='*', s=1500, label="$M_L$ 5.4 Mainshock")
ax.scatter(x[2395], y[2395], z[2395], c='r', marker='*', s=1500, label="$M_L$ 4.6 Aftershock")

ax.set_xlabel('Latitude ($^\circ$)', fontsize=30, labelpad=30)
ax.set_ylabel('Longitude ($^\circ$)', fontsize=30, labelpad=30)
ax.set_zlabel('Depth (km)', fontsize=30, labelpad=20)

ax.set_zticklabels(['8','7','6','5','4','3','2'])

ax.xaxis.set_tick_params(labelsize=20)
ax.yaxis.set_tick_params(labelsize=20)
ax.zaxis.set_tick_params(labelsize=20)

plt.legend(prop={'size': 30})
plt.show()

The resulting plot looks like below. 3D hypocenter plot
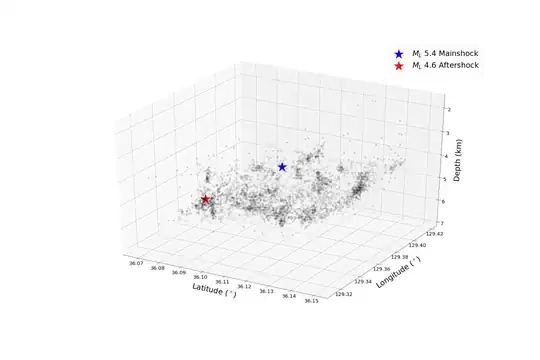
In this figure, the color of every dot is same. However, I want it to be smoothly differ with gradation as associated time (Year, Month, Day, Hour, Min, Sec) increases with the colorbar. The example would be like below (although color changes as depth, not time for this example).

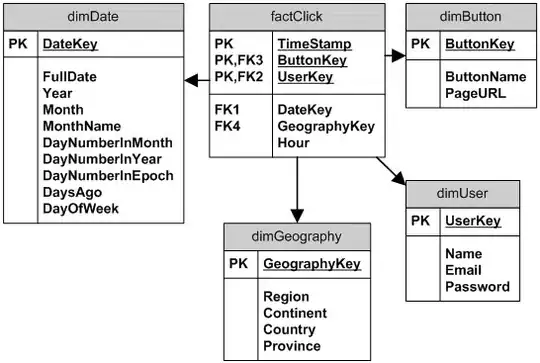
benchmark example

Senna
  • 149
  • 1
  • 1
  • 10

1 Answers1

1

I have been doing some tests and I have gotten this to work.

  1. Create a new column on your catalog dataframe with the time information in datetime format. To do so use pd.to_datetime:
collect['DateHour'] =  pd.to_datetime(collect['Year'].astype(str) \
+ '/' + collect['Month'].astype(str) + '/' + \
collect['Day'].astype(str) \ 
+ 'T' + collect['Hour'].astype(str)+ ':' + collect['Min'].astype(str) \
 ':' + collect['Sec'].astype(str))

2A. You can use this new column to plot it straightly as a color, by indicating it in the c parameter of your ax.scatter function, but it might not make for a very pretty colorbar.

2B. Or if you want to have a colobar indicating for example a time difference in days to a particular date-time (for example your first date in the data), you can create a new column by simply making the difference of collect['DateHour'] column to the date-time instance properly formatted (or taken from collect['DateHour']), and then transform the time delta to your desired unit to measure the time increment. You can see here some examples on how to transform timedelta64 to a convenient time measure. In this example it is transformed to days:

collect['dt_days'] = (collect['DateHour']-pd.to_datetime('2002-02-03T13:56:03.172')) \
/ np.timedelta64(1, 'D')

3B. Use this column by indicating it in the c parameter of your ax.scatter

Roberto
  • 138
  • 8