I asked a question before, but now I would like to know how do I put the labels above the bars.
post old: how to create a frequency histogram with predefined non-uniform intervals?
dataframe <- c (1,1.2,40,1000,36.66,400.55,100,99,2,1500,333.45,25,125.66,141,5,87,123.2,61,93,85,40,205,208.9)
Upatdate
Update
Following the guidance of the colleague I am updating the question.
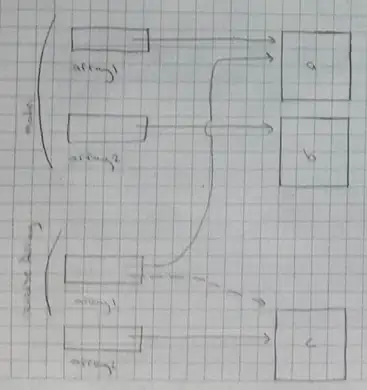
I have a data base and I would like to calculate the frequency that a given value of that base appears within a pre-defined range, for example: 0-50, 50-150, 150-500, 500-2000.
in the post(how to create a frequency histogram with predefined non-uniform intervals?) I managed to do this, but I don't know how to add the labels above the bars. I Tried:
barplort (data, labels = labels), but it didn't work.
I used barplot because the post recommended me, but if it is possible to do it using ggplot, it would be good too.