2

I want to get sample data per instruction. It turned out such tool is a little bit difficult to find.

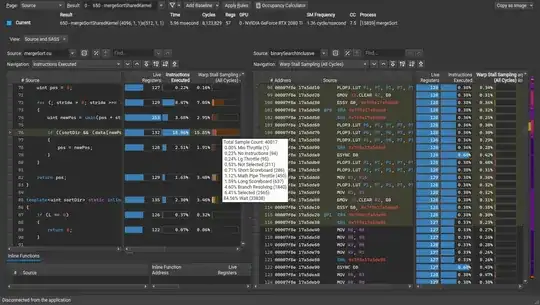
The image below is a good example from Nvidia Nsight compute for profiling GPU programs.

At the right hand side, you can clear see each assembly code and the corresponding counters like how many time it get executed and the reason why it cannot be dispatched, i.e. Sampling Data (Not Issued).

Correlation between source code(left part) and assembly code is NOT necessary in my request.

example from nvidia nsight compute

For the detail of Nsight compute: https://docs.nvidia.com/nsight-compute/NsightCompute/index.html#profiler-report-source-page

I know about hot method and other profiling techniques. However I need very detailed profiling result for a piece of assembly code

Peter Cordes
  • 328,167
  • 45
  • 605
  • 847
worldterminator
  • 2,968
  • 6
  • 33
  • 52
  • If you're on Linux, `perf record` / `perf report` can do that (for a variety of events such as "cycles", not just "instructions executed"). Similar tools for other OSes exist, notably Intel VTune and AMD CodeAnalyst. Google also found https://developer.amd.com/amd-uprof/ – Peter Cordes Dec 03 '20 at 17:12
  • Possible duplicate: [What's your favorite profiling tool (for C++)](https://stackoverflow.com/q/26663) but it doesn't focus on per-instruction counts on a small scale. (Which is non-trivial to make use of on out-of-order execution CPUs like modern x86...) – Peter Cordes Dec 03 '20 at 17:21

0 Answers0