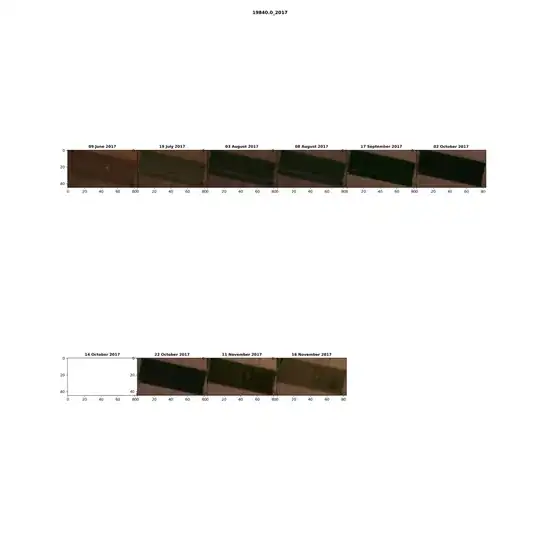
images = wcs_request.get_data()  # get image data
fig, axs = plt.subplots((len(images) + (6 - 1)) // 6, 6, figsize=(20, 20),
                        gridspec_kw={'hspace': 0.0, 'wspace': 0.0})

total = ((len(images) + (6 - 1)) // 6) * 6

for idx, (image, time) in enumerate(zip(images, wcs_request.get_dates())):
    # Plot bbox
    axs.flat[idx].imshow(image)
    # Set title
    axs.flat[idx].set_title(time.date().strftime("%d %B %Y"), fontsize=10, fontweight='bold')

# delete plots which have no data
for idx in range(len(images), total):
    fig.delaxes(axs.flat[idx])

plt.suptitle(id, fontsize=12, fontweight='bold')
# fig.tight_layout(pad=0, h_pad=.1, w_pad=.1)
# fig.subplots_adjust(wspace=0, hspace=0)
plt.savefig(dir_out / f'{id}_map.png', dpi=300)
plt.close()
When I run the code above, I get a subplot with much larger vertical blank space than I want. How can I fix it? I already set wspace and hspace to 0.0

