I am going through seaborn.jointplot() documentation (link) and it says that this function has these parameters:
seaborn.jointplot(*, x=None, y=None, data=None, kind='scatter', color=None, height=6, ratio=5, space=0.2, dropna=False, xlim=None, ylim=None, marginal_ticks=False, joint_kws=None, marginal_kws=None, hue=None, palette=None, hue_order=None, hue_norm=None, **kwargs)
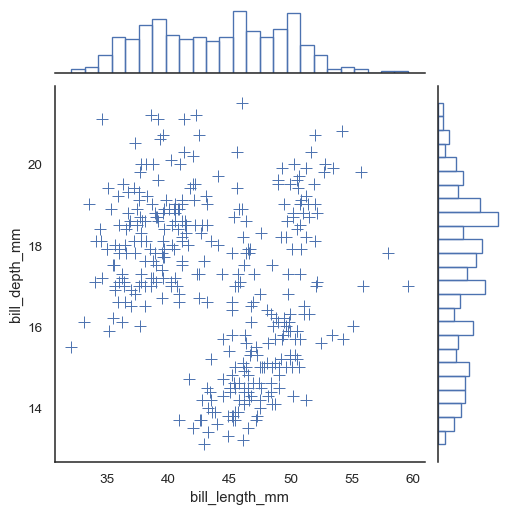
We can clearly see that there are no marker or s parameters. However, later in the same page there is an example: sns.jointplot(data=penguins, x="bill_length_mm", y="bill_depth_mm", marker="+", s=100, marginal_kws=dict(bins=25, fill=False)) that outputs this figure without any errors.
My question is why can values for parameters marker or s be provided and no error is raised, even if these parameters are not listed in the official documentation as seen above? Also, where can I find other parameters (besides marker or s), that are not listed in the official documentation, but are accepted by seaborn.jointplot()?
Thank you.