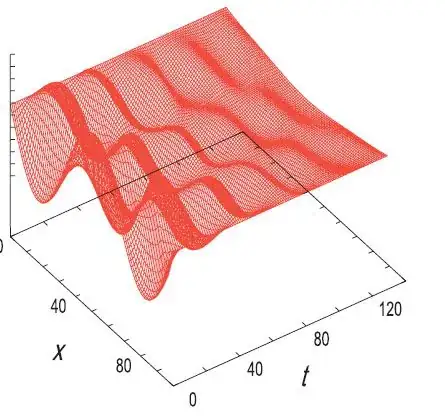
I want my plot to look like this without those walls of planes:

But when I use mplot3d, I get this:

How to I remove the walls at the edges?
I want my plot to look like this without those walls of planes:

But when I use mplot3d, I get this:

How to I remove the walls at the edges?
I am not sure you can turn that off the panes but you can access its child properties and make them transparent if you wish.
import numpy as np
import matplotlib.pyplot as plt
import matplotlib.tri as mtri


fig = plt.figure(figsize=[15, 8])

# Make a mesh in the space of parameterisation variables u and v
u = np.linspace(0, 2.0 * np.pi, endpoint=True, num=50)
v = np.linspace(-0.5, 0.5, endpoint=True, num=10)
u, v = np.meshgrid(u, v)
u, v = u.flatten(), v.flatten()

# This is the Mobius mapping, taking a u, v pair and returning an x, y, z
# triple
x = (1 + 0.5 * v * np.cos(u / 2.0)) * np.cos(u)
y = (1 + 0.5 * v * np.cos(u / 2.0)) * np.sin(u)
z = 0.5 * v * np.sin(u / 2.0)

# Triangulate parameter space to determine the triangles
tri = mtri.Triangulation(u, v)

# Plot the surface.  The triangles in parameter space determine which x, y, z
# points are connected by an edge.
ax = fig.add_subplot(1, 2, 1, projection='3d')
ax.plot_trisurf(x, y, z, triangles=tri.triangles, cmap=plt.cm.Spectral)
ax.set_zlim(-1, 1)

ax.xaxis.set_pane_color((1.0, 1.0, 1.0, 0.0))
ax.yaxis.set_pane_color((1.0, 1.0, 1.0, 0.0))
ax.zaxis.set_pane_color((1.0, 1.0, 1.0, 0.0))
# make the grid lines transparent
ax.xaxis._axinfo["grid"]['color'] =  (1,1,1,0)
ax.yaxis._axinfo["grid"]['color'] =  (1,1,1,0)
ax.zaxis._axinfo["grid"]['color'] =  (1,1,1,0)