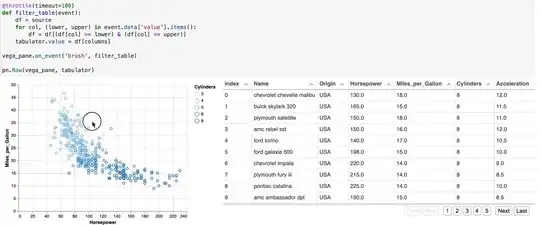
To my understanding, there is no official support for emitting signals/events from interactions in VegaLite/Altair, such as selecting points in a scatter plot, other than to charts in the same view/composition.
Is there currently any workaround for this that would capture which points are selected in a scatter plot and process them outside VegaLite ("outside" = in Python for me as I am using Altair)?
For example, could I make a selection persistent and saved to a json spec that I could parse in Python? Or could I write a custom javascript function that is triggerd by a chart selection and saved as a Python variable or printed to some stream that I could read from Python?
Example code from the docs for a chart with an interactive selection:
import altair as alt
from vega_datasets import data

brush = alt.selection_interval()
chart = alt.Chart(data.cars.url).mark_point().encode(
    x='Horsepower:Q',
    y='Displacement:Q',
    color=alt.condition(brush, 'Origin:N', alt.value('lightgray')),
    tooltip='Horsepower:Q').add_selection(brush)
chart
