Anyway, I'm kind of trying (this is actually my first manim program).
from manim import *
import copy
import numpy as np
import random

color_palette = [BLUE, GREEN, YELLOW, GREY_BROWN]

class TestPie(Scene):
    def construct(self):
        n_elements = 3
        radius = 1
        weights = np.random.rand(n_elements)
        weights /= weights.sum()
        angles = weights*np.pi*2
        angles_offset = [0]+np.cumsum(weights*np.pi*2)[:-1].tolist()
        arcs = [Arc(angles_offset[i], angles[i]) for i in range(n_elements)]
        arcs2 = copy.deepcopy(arcs)
        triangles = [Polygon(*[
            # first element
            (radius*np.cos(angles_offset[i]), radius*np.sin(angles_offset[i]),0),
            (0, 0, 0), # second element
            # third element
            (radius*np.cos(angles_offset[(i+1)%n_elements]),
             radius*np.sin(angles_offset[(i+1)%n_elements]), 0)], stroke_width=0)
                    for i in range(n_elements)]
        lines = [Line((0,0,0),
                      (radius*np.cos(angles_offset[i]), radius*np.sin(angles_offset[i]), 0))
                 for i in range(n_elements)]
        for i in range(n_elements):
            arcs2[i].set_fill(color_palette[i%len(color_palette)], opacity=0.5)
            triangles[i].set_fill(color_palette[i%len(color_palette)], opacity=0.5)

        self.play(
            *map(lambda obj: ShowCreation(obj, run_time=1), arcs),
            *map(lambda obj: ShowCreation(obj, run_time=1), lines),
        )
        self.play(
            *map(lambda i: Transform(arcs[i], arcs2[i], runtime=1), range(n_elements)),
            *map(lambda obj: FadeIn(obj, run_time=1), triangles),

        )

        self.wait()
        weights = np.random.rand(n_elements)
        weights /= weights.sum()
        angles = weights*np.pi*2
        angles_offset = [0]+np.cumsum(weights*np.pi*2)[:-1].tolist()
        arcs2 = [Arc(angles_offset[i], angles[i]) for i in range(n_elements)]
        lines2 = [Line((0,0,0),
                       (radius*np.cos(angles_offset[i]), radius*np.sin(angles_offset[i]), 0))
                  for i in range(n_elements)]
        triangles2 = [Polygon(*[
            # first element
            (radius*np.cos(angles_offset[i]), radius*np.sin(angles_offset[i]),0),
            (0, 0, 0), # second element
            # third element
            (radius*np.cos(angles_offset[(i+1)%n_elements]),
             radius*np.sin(angles_offset[(i+1)%n_elements]), 0)], stroke_width=0)
                    for i in range(n_elements)]

        for i in range(n_elements):
            arcs2[i].set_fill(color_palette[i%len(color_palette)], opacity=0.5)
            triangles2[i].set_fill(color_palette[i%len(color_palette)], opacity=0.5)

        self.play(
            *map(lambda i: Transform(lines[i], lines2[i],
                                     runtime=1), range(n_elements)),
            *map(lambda i: Transform(arcs[i], arcs2[i],
                                     runtime=1), range(n_elements)),
            *map(lambda i: Transform(triangles[i], triangles2[i],
                                     runtime=1), range(n_elements)),
        )
        self.wait(2)
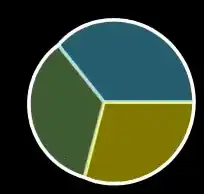
The output:

Thus, I have two problems with my current program. And I would appreciate a little help.
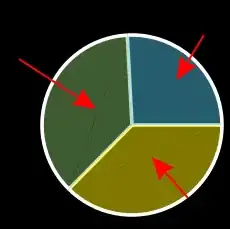
1. Since I'm using triangles and arcs, I get an ugly gap as you can see in the following picture.
2. I'm getting ugly transformations with the Arc, Triange and Line classes, the transformations should follow the circumference which is not the case right now. You can appreciate more one of the intermediary ugly steps in the image below. (As you can see, it's not round any more)