4

In a recent SO discussion I displayed a binary classification tree that needed some pruning of vertices 6 and 7:

needs pruning

Below is the code I used:

KaryTree[9, 2, 
 VertexLabels -> {1 -> "Blood pressure > 91 ?", 2 -> "Age > 62.5?", 
   4 -> "Sinus tachycardia ?", 8 -> "< 30 days"}, 
 EdgeLabels -> {1 \[UndirectedEdge] 2 -> "yes", 
   1 \[UndirectedEdge] 3 -> "no", 2 \[UndirectedEdge] 4 -> "yes", 
   2 \[UndirectedEdge] 5 -> "no", 4 \[UndirectedEdge] 8 -> "yes", 
   4 \[UndirectedEdge] 9 -> "no"}, ImagePadding -> 20]

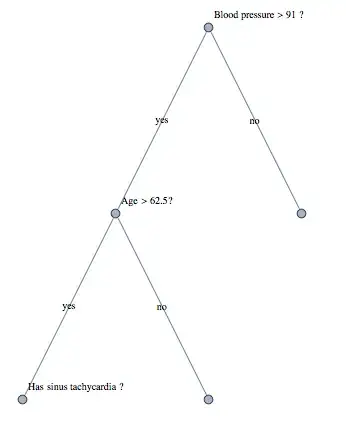
If leaves 6 and 7 are pruned by VertexDelete, vertices 8 and 9 are also clipped:

VertexDelete[
   KaryTree[7, 2, 
     VertexLabels -> {1 -> "Blood pressure > 91 ?", 2 -> "Age > 62.5?", 
                      4 -> "Has sinus tachycardia ?"}, 
     EdgeLabels -> {1 \[UndirectedEdge] 2 -> "yes", 
                    1 \[UndirectedEdge] 3 -> "no", 2 \[UndirectedEdge] 4 -> "yes", 
                    2 \[UndirectedEdge] 5 -> "no"}, ImagePadding -> 20], {6, 7}]

VertexDelete

TreeGraph is willing to plot the graph, but it has its own mind about how the graph should be laid out:

TreeGraph[{1 \[UndirectedEdge] 2, 1 \[UndirectedEdge] 3, 
           2 \[UndirectedEdge] 4, 2 \[UndirectedEdge] 5, 4 \[UndirectedEdge] 6,
           4 \[UndirectedEdge] 7}, 
   VertexLabels -> {1 -> "Blood pressure > 91 ?", 2 -> "Age > 62.5?", 
                    4 -> "Has sinus tachycardia ?", 6 -> "< 30 days"}, 
   EdgeLabels -> {1 \[UndirectedEdge] 2 -> "yes", 
                  1 \[UndirectedEdge] 3 -> "no", 2 \[UndirectedEdge] 4 -> "yes", 
                  2 \[UndirectedEdge] 5 -> "no", 4 \[UndirectedEdge] 6 -> "yes", 
                  4 \[UndirectedEdge] 7 -> "no"}, ImagePadding -> 20]

TreeGraph

I'd like vertex 1 to be displayed at the top as the root of the graph.

I've played around with various GraphLayout settings but not found a solution. Any ideas?

Community
  • 1
  • 1
DavidC
  • 3,056
  • 1
  • 20
  • 30
  • +1, I'm also interested in more control over this. Perhaps when you only have trees, it's better not to use a generic graph data structure, but something tree-specific. A relatively recent (unanswered!) mathgroup post asked about how to control which branch goes left and which goes right in the tree. Sometimes it is necessary to keep the tree leafs ordered. – Szabolcs Jul 05 '11 at 18:57
  • @Szabolcs Yes, I used the KaryTree in this case because I wanted all the "yes" responses to run down the left. If you hand over the layout to TreeGraph, it lets two yes branches and one no branch descend from the Age node. This is hard to understand as a sequence of decisions made by a doctor. Of course, you can set the vertex coordinates one by one, but that becomes too clumsy when you have more than a few nodes. – DavidC Jul 05 '11 at 21:25

1 Answers1

2

Perhaps you may use:

vertex = {1 -> "Blood pressure > 91 ?",   2 -> "Age > 62.5?", 
          4 -> "Has sinus tachycardia ?", 6 -> "< 30 days"}; 

TreePlot[{{1 -> 2, yes}, {1 -> 3, no},  {2 -> 4, yes}, 
          {2 -> 5, no},  {4 -> 6, yes}, {4 -> 7, no}} /. vertex, Top, 
         1 /. vertex, VertexLabeling -> True]

enter image description here

Edit

Or, If you want a better emulation:

gr = Graphics[
     List[Hue[0.6`, 0.2`, 0.8`], EdgeForm[Opacity[0.7`]], 
      Disk[List[2.5021729686848975, 1.6681153124565984], 0.02965727689850835]], 
     Rule[ImageSize, List[13.`, Automatic]]] ;

vertex = {1 -> "Blood pressure > 91 ?",   2 -> "Age > 62.5?", 
          4 -> "Has sinus tachycardia ?", 6 -> "< 30 days",
          3 -> "",  5 -> "  ", 7 -> "   "};

TreePlot[{{1 -> 2, yes}, {1 -> 3, no }, {2 -> 4, yes}, 
          {2 -> 5,  no}, {4 -> 6, yes}, {4 -> 7, no}}/. vertex, Top, 1/. vertex, 
 VertexLabeling -> True, 
 PlotStyle -> Hue[0.6`, 0.7`, 0.5`], 
 VertexRenderingFunction -> ({Inset[gr, #1], Inset[#2, #1, {-1.3, -1}]} &)]  

enter image description here

Dr. belisarius
  • 60,527
  • 15
  • 115
  • 190
  • Yes, TreePlot solves the problem with no need to tweak the display. It seems like the better tool for this job. – DavidC Jul 06 '11 at 21:47