How is possible to add this unit :m^3×s^(-1)×(km^(-1)),on the y axis side by side with the axis name on my plot on ggplot2? My script is:
p <- ggplot(data=H0T, aes(x=Ano, y=UIN))+
  geom_boxplot(aes(Ano,UIN,group=Ano))+
  facet_wrap( ~ Mes, scales="free_x")+
  labs(x=NULL, y="Upwelling Index",parse=TRUE)

p + scale_x_continuous(breaks = c(2012:2018),
                       labels = factor(2012:2018))

# A tibble: 2,557 x 7
     Ano Mes       Dia      UI Date            UIT   UIN
   <dbl> <fct>   <dbl>   <dbl> <date>        <dbl> <dbl>
 1  2012 January     1   37.9  2012-01-01 -0.269   0.471
 2  2012 January     2 -292.   2012-01-02 -0.510   0.454
 3  2012 January     3   -4.65 2012-01-03 -0.300   0.469
 4  2012 January     4  146.   2012-01-04 -0.190   0.477
 5  2012 January     5  110.   2012-01-05 -0.217   0.475
 6  2012 January     6  394.   2012-01-06 -0.00835 0.490
 7  2012 January     7  170.   2012-01-07 -0.173   0.478
 8  2012 January     8  115.   2012-01-08 -0.213   0.475
 9  2012 January     9   46.2  2012-01-09 -0.263   0.472
10  2012 January    10  -75.6  2012-01-10 -0.352   0.465
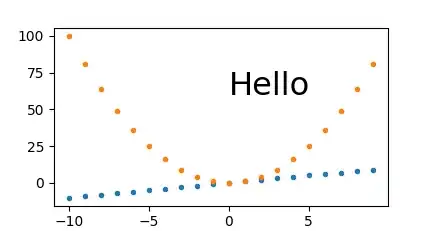
And I want the y axis like this one:
 Thank you for the help!