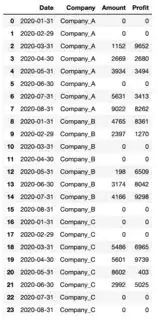
I have a data set that has has the sales amount and profit of a given company in a given month. In some months, a company won't conduct any business, and thus it will be missing from the data for that given month. I would like to create rows for these missing months and fill the amount/profit variables with 0.
Code to Reproduce the Data:
import pandas as pd
import numpy as np
import itertools
from datetime import datetime

np.random.seed(2021)

company_list = ['Company_A', 'Company_B', 'Company_C']
datelist = pd.date_range(start="2020-01-01", end='2020-08-01', freq='MS').to_list()

df = pd.DataFrame(list(itertools.product(company_list, datelist)))
df.columns = ['Company', 'Date']

df['Amount'] = np.random.choice(range(0,10000), df.shape[0])
df['Profit'] = np.random.choice(range(0,10000), df.shape[0])

df['Date'] = df['Date'] + pd.tseries.offsets.MonthEnd(1)

df = df.drop([0,1,5,10,11,15,16,17,22,23]).reset_index(drop=True) #Dropping some rows just to illustrate what my data looks like

df
I've figure out how to do this using the help I found in this post, however it uses the min/max ranges of all dates in the 'Date' column. Because the observations for my companies begin and end at different times, this adds dates from before I first observe them and after they disappear from the data, which is not what I want.
df.set_index(
    ['Date', 'Company']
).unstack(
    fill_value = 0
).asfreq(
    'M'
).stack().sort_index(level=1).reset_index()
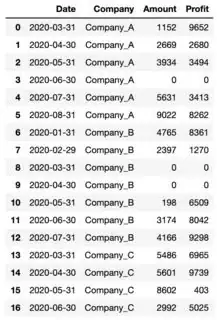
What I want instead is to only add the missing dates that would result from the min/max dates of the specific group, i.e. just the dates missing in between, not on the ends.
How the Data should look:


