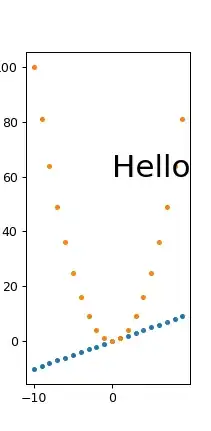
Is there a library that I can use to generate the plot below?
The closest I got was to generate 2 separate plots and then convert them to numpy array images and to then sum them together. But I would not have the legends in my solution.
import cv2
import numpy as np
import matplotlib.pyplot as plt

fig = plt.figure()
ax = fig.add_subplot(111)

ax.plot(range(10),'b')
ax.set_xlabel('A')
ax.set_ylabel('B')
ax.yaxis.set_label_position("right")
ax.spines['bottom'].set_color('blue')
ax.spines['right'].set_color('blue')
ax.xaxis.label.set_color('blue')
ax.yaxis.label.set_color('blue')
ax.tick_params(axis='x', colors='blue')
ax.tick_params(axis='y', colors='blue')
ax.tick_params(right=True, left=False, top=False, labelleft=False, labelright=True)

fig.canvas.draw()
data = np.fromstring(fig.canvas.tostring_rgb(), dtype=np.uint8, sep='')
data = data.reshape(fig.canvas.get_width_height()[::-1] + (3,))

fig = plt.figure()
ax = fig.add_subplot(111)

ax.plot(range(10),'r')
ax.set_xlabel('A')
ax.set_ylabel('B')
ax.xaxis.set_label_position("top")
ax.spines['top'].set_color('red')
ax.spines['left'].set_color('red')
ax.xaxis.label.set_color('red')
ax.yaxis.label.set_color('red')
ax.tick_params(axis='x', colors='red')
ax.tick_params(axis='y', colors='red')
ax.tick_params(left=True, right=False, bottom=False, top=True, labeltop=True, labelbottom=False)

fig.canvas.draw()
data = np.fromstring(fig.canvas.tostring_rgb(), dtype=np.uint8, sep='')
data = data.reshape(fig.canvas.get_width_height()[::-1] + (3,))


