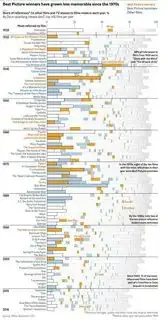
I've been trying to plot a graph like figure 1 (see below), but I am wondering how can I can the label on the left hand side.
Below is my R code and my result:
library(ggplot2)
library(data.table)

setwd("/users/ryan/desktop/R_Programming")
moviecounts  <- fread('movie-counts.csv', header = T, stringsAsFactors = F)

ggplot(moviecounts[year_rank <=100]) +
  xlim(2016,1927)+
  scale_fill_manual(values = c("#ffffff", "#afd0df", "#f6a100"))+
  geom_col(aes(fill=result, y=annual_share, x=oscars_year,group = count),
  colour="#eeeeee")+
  coord_flip()+
  theme_minimal()
Below is the top 20 rows of my dataset:
dput(head(moviecounts, 20))

structure(list(movie_name = c("Star Wars: Episode IV - A New Hope",
"The Wizard of Oz", "The Godfather", "Star Wars: Episode V - The Empire Strikes Back",
"Jaws", "Psycho", "Casablanca", "Raiders of the Lost Ark", "The Terminator",
"E.T. the Extra-Terrestrial", "Ghostbusters", "2001: A Space Odyssey",
"Gone with the Wind", "Back to the Future", "Titanic", "The Shining",
"Star Wars: Episode VI - Return of the Jedi", "Jurassic Park",
"The Matrix", "King Kong"), release_year = c(1977L, 1939L, 1972L,
1980L, 1975L, 1960L, 1942L, 1981L, 1984L, 1982L, 1984L, 1968L,
1939L, 1985L, 1997L, 1980L, 1983L, 1993L, 1999L, 1933L), oscars_year = c(1977L,
1939L, 1972L, 1980L, 1975L, 1960L, 1943L, 1981L, 1984L, 1982L,
1984L, 1968L, 1939L, 1985L, 1997L, 1980L, 1983L, 1993L, 1999L,
1933L), ceremony = c("50th", "12th", "45th", "", "48th", "",
"16th", "54th", "", "55th", "", "", "12th", "", "70th", "", "",
"", "", ""), result = c("N", "N", "W", "", "N", "", "W", "N",
"", "N", "", "", "W", "", "W", "", "", "", "", ""), count = c(4965L,
3291L, 1767L, 1748L, 1570L, 1563L, 1454L, 1396L, 1355L, 1331L,
1225L, 1176L, 1154L, 1150L, 1128L, 1127L, 1091L, 1081L, 1081L,
1053L), overall_rank = 1:20, year_rank = c(1L, 1L, 1L, 1L, 1L,
1L, 1L, 1L, 1L, 1L, 2L, 1L, 2L, 1L, 1L, 2L, 1L, 1L, 1L, 1L),
    annual_share = c(0.551789286508113, 0.503441945846719, 0.33695652173913,
    0.20161476355248, 0.313123254886318, 0.434166666666667, 0.486776029460998,
    0.226182760855476, 0.143416596104996, 0.164829721362229,
    0.129657070279424, 0.216017634092579, 0.176533578093927,
    0.174374526156179, 0.171715634038666, 0.129988465974625,
    0.164878343660269, 0.160647941744687, 0.142857142857143,
    0.376879026485326)), row.names = c(NA, -20L), class = c("data.table",
"data.frame"), .internal.selfref = <pointer: 0x7f9e868174e0>)

