0

Currently, I have a plot that looks like this:

library(ggplot2)

df <- ToothGrowth

df %>% 
  ggplot(aes(x = supp, y = len, fill = supp)) + 
  geom_flat_violin(position = position_nudge(x = .2, y = 0),
                   alpha = .8) +
  geom_point(aes(shape = supp),
             position = position_jitter(width = .05),
             size = 2, alpha = 0.8) +
  geom_boxplot(width = .1, outlier.shape = NA, alpha = 0.5) +
  coord_flip() +
  labs(title = "ToothGrowth Length by Supplement",
       y = "Length") +
  theme_classic() +
  raincloud_theme

plot

I'd like to change the order so that OJ appears above VC. I've tried adding scale_x_discrete before coord_flip(), but that seems to mess up my plot as this is a raincloud plot -- I'd have to move not only the violin plot, but also the points and the box plot. I've also tried adding rev(), which also messed up my plot. What is the best way to reorder this?

EDIT

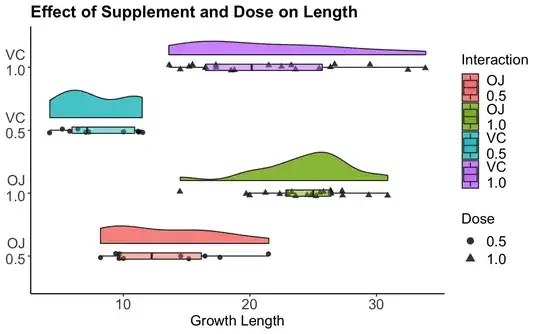
Thank you for the comment! How do I change the orders in an interaction plot?

df %>% 
  mutate(Supplement = ifelse(supp == "VC",
                        "VC",
                        "OJ"),
         Dose = ifelse(dose == "0.5",
                           "0.5",
                           "1.0"),
         Interaction = factor(str_replace(interaction(Supplement, Dose),
                                          '\\.', '\n'),
                              ordered=TRUE)) %>% 
  ggplot(aes(x = Interaction, y = len, fill = Interaction)) + 
  geom_flat_violin(position = position_nudge(x = .2, y = 0),
                   alpha = .8) +
  geom_point(aes(shape = Dose),
             position = position_jitter(width = .05),
             size = 2, alpha = 0.8) +
  geom_boxplot(width = .1, outlier.shape = NA, alpha = 0.5) +
  coord_flip() +
  labs(title = "Effect of Supplement and Dose on Length",
       y = "Growth Length") +
  scale_fill_discrete(guide = guide_legend(override.aes = list(shape = c(".", ".")))) +
  scale_shape_discrete(guide = guide_legend(override.aes = list(size = 3))) +
  theme_classic() +
  raincloud_theme

enter image description here

user15141497
  • 73
  • 1
  • 6
  • The general approach to changing the order of plotting that is being done on the basis of factors is to change the order of the levels parameter of the controlling factor. I'm pretty sure this ahs been asked and answered many times on SO. – IRTFM Feb 20 '21 at 01:01
  • @IRTFM indeed. see suggested duplicate (50 upvotes, 100k views). But this is not the only thread for sure – tjebo Feb 20 '21 at 17:20
  • Again: Probably asked and answered. Search on `[r] ggplot order interaction` produces this as second hit: https://stackoverflow.com/questions/57728103/change-stacked-bar-order-when-aesthetic-fill-is-based-on-the-interaction-of-two – IRTFM Feb 20 '21 at 17:29

1 Answers1

1

ggplot2 will interpret the supp factor and the order in the plot correspond to the levels of the factor.

You will need to change the levels of the supp factor.

df <- ToothGrowth
df$supp
df$supp <- relevel(ToothGrowth$supp,ref = "VC") 
df$supp
df %>% 
  ggplot(aes(x = supp, y = len, fill = supp)) + 
  geom_flat_violin(position = position_nudge(x = .2, y = 0),
                   alpha = .8) +
  geom_point(aes(shape = supp),
             position = position_jitter(width = .05),
             size = 2, alpha = 0.8) +
  geom_boxplot(width = .1, outlier.shape = NA, alpha = 0.5) +
  coord_flip() +
  labs(title = "ToothGrowth Length by Supplement",
       y = "Length") +
  theme_classic() +
  raincloud_theme
L47
  • 84
  • 3
  • Thank you! What would be the best way to relevel factors in an interaction plot? I've edited my original post so that it includes the interaction plot as well. – user15141497 Feb 20 '21 at 01:44