I worked on a project that accomplished something very similar a while back in R. Here's a video example showing the proof-of-concept (no audio). https://www.screencast.com/t/xa0yemiDPl
It essentially shows the end state of using Tableau to interactively examine the description of wines in a word-cloud for the selected countries. The key components were:
- have Tableau connect to the data to analyze, as well as a placeholder dataset that has the number of records you expect to get back from your Python/R code (the call out to Python/R from Tableau expects to get back the same number of records it sends off to process... that can be problematic if your sending text data, but processing it to return back many more records - as would be the case in the word cloud example)
- have the Python/R code connect to your data and return the Word and Frequency counts in a single vector, separated by a delimiter (what Tableau will require for a word cloud)
- split the single vector using Tableau Calculated Fields
- leverage parameter actions to select parameter values to pass to the Python/R code
High-Level Overview
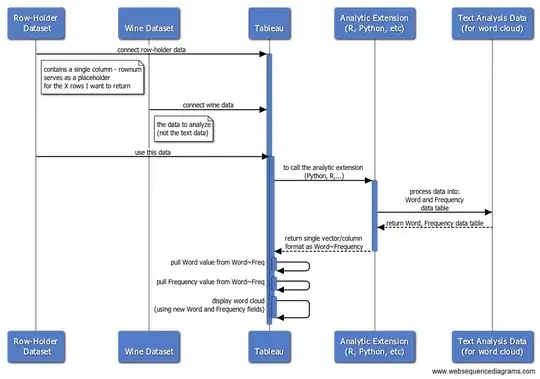
Tableau Calculated Field - [R Words+Freq]:
Script_Str('
print("STARTING NEW SCRIPT RUN")
print(Sys.time())
print(.arg2) # grouping
print(.arg1) # selected country


# TEST VARIABLE (non-prod)
.MaxSourceDataRecords = 1000 # -1 to disable

# TABLEAU PARAMETER VARIABLES
.country = "' + [Country Parameter] + '"
.wordsToReturn = ' + str([Return Top N Words]) + '
#^^^^^^^^^^^^^^^^^^^^^^^^^^^^^^^^^^^^^^^^^^^^^^^^^^^#

# VARIABLES DERIVED FROM TABLEAU PARAMETER VALUES
.countryUseAll = (.country == "All")
print(.countryUseAll)
#^^^^^^^^^^^^^^^^^^^^^^^^^^^^^^^^^^^^^^^^^^^^^^^^^^^#

#setwd("C:/Users/jbelliveau/....FILL IN HERE...")
.fileIn = ' + [Source Data Path] + '
#.fileOut = "winemag-with-DTM.csv"

#install.packages("wordcloud")
#install.packages("RColorBrewer") # not needed if installed wordcloud package

library(tm)
library(wordcloud)
library(RColorBrewer) # color package (maps or wordclouds)

wineAll = read.csv(.fileIn, stringsAsFactors=FALSE)

# TODO separately... polarity

# use all the data or just the parameter selected
print(.countryUseAll)

if ( .countryUseAll ) {
  wine = wineAll # filter down to parameter passed from Tableau
}else{
  wine = wineAll[c(wineAll$country == .country),] # filter down to parameter passed from Tableau
}

# limited data for speed (NOT FOR PRODUCTION)
if( .MaxSourceDataRecords > 0 ){
  print("limiting the number of records to use from input data")
  wine = head(wine, .MaxSourceDataRecords)
}


corpus = Corpus(VectorSource(wine$description))
corpus = tm_map(corpus, tolower)
#corpus = tm_map(corpus, PlainTextDocument) # https://stackoverflow.com/questions/32523544/how-to-remove-error-in-term-document-matrix-in-r/36161902
corpus = tm_map(corpus, removePunctuation)
corpus = tm_map(corpus, removeWords, stopwords("English"))
#length(corpus)

dtm = DocumentTermMatrix(corpus)

#?sample
mysample = dtm # no sampling (used Head on data read... for speed/simplicity on this example)
#mysample <- dtm[sample(1:nrow(dtm), 5000, replace=FALSE),]
#nrow(mysample)
wineSample = as.data.frame(as.matrix(mysample))

# column names (the words)
# use colnames to get a vector of the words
#colnames(wineSample)

# freq of words
# colSums to get the frequency of the words
#wineWordFreq = colSums(wineSample)

# structure in a way Tableau will like it
wordCloudData = data.frame(words=colnames(wineSample), freq=colSums(wineSample))
str(wordCloudData)

# sort by word freq
wordCloudDataSorted = wordCloudData[order(-wordCloudData$freq),]

# join together by ~ for processing once Tableau gets it
wordAndFreq = paste(wordCloudDataSorted[, 1], wordCloudDataSorted[, 2], sep = "~")

#write.table(wordCloudData, .fileOut, sep=",",row.names=FALSE) # if needed for performance refactors

topWords = head(wordAndFreq, .wordsToReturn)
#print(topWords)

return( topWords )

',
Max([Country Parameter])
, MAX([RowNum]) // for testing the grouping being sent to R
)
Tableau Calculated Field for the Word Value:
// grab the first token to the left of ~
Left([R Words+Freq], Find([R Words+Freq],"~") - 1)
Tableau Calculated Field for the Frequency Value:
INT(REPLACE([R Words+Freq],[Word]+"~",""))
If you're not familiar with Tableau, you'll likely want to work alongside a Tableau analyst at your company that is. They'll be able to help you create the calculated fields and configure Tableau to connect to TabPy.