I would like to know how to set the axis range and achieve the same behavior that Google Image Charts had. Here is the example for the same request URL:
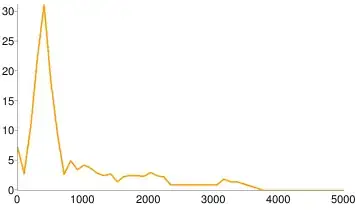
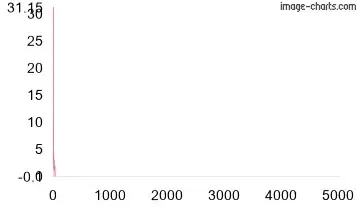
I.e., I have an y value on each 100th of x axis. Is there a way to easily define a dataset 'step' for Image Charts, or I have to create custom labels on x axis with chxl, which I would like to avoid?