0

Working on a Partial Order Hasse plot for a research paper. Looking to customize the output of hasse() function from the hasseDiagram package but not sure how. I have taken a look under the hood, but it is unclear where I might be able to set parameters to drive:

  1. Label Colors
  2. Arrow Sizes and Shapes

Any ideas?

Example:

library("hasseDiagram")
test_data <- generateRandomData(20, 3, 0.5)
hasse(test_data)
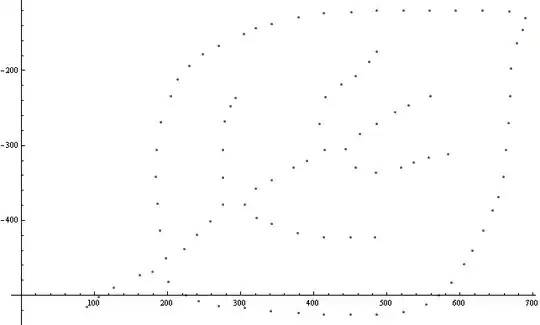
enter image description here

Stu
  • 1,543
  • 3
  • 17
  • 31
  • 2
    Can you make a "minimum reproducible example"? https://stackoverflow.com/questions/5963269/how-to-make-a-great-r-reproducible-example – Nate Mar 10 '21 at 18:28
  • Just added. There are no graphical parameters to add. This is more a question of how to "dive" into the function and customize to accept visual parameters. – Stu Mar 10 '21 at 19:27
  • 1
    `getAnywhere("hasse")` should show you the source code – Nate Mar 10 '21 at 21:47

0 Answers0