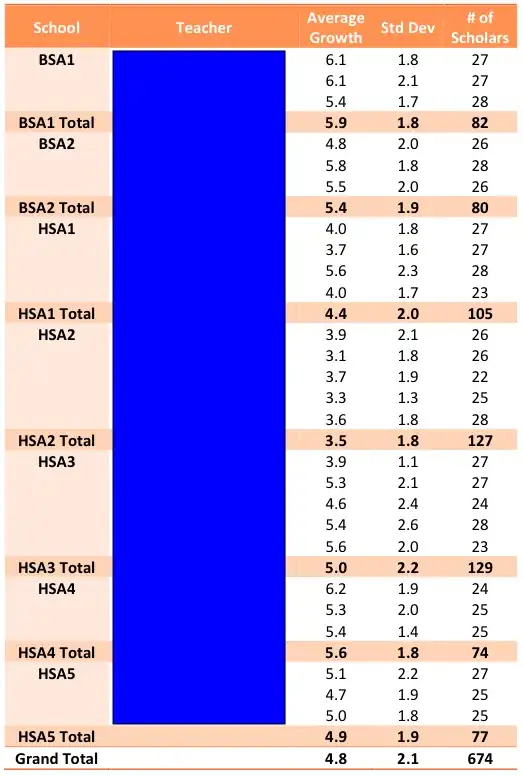
I am writing a report that requires the generation of a number of pivot tables in Excel. I would like to think there is a way to do this in R so that I can avoid Excel. I would like output like the screenshot below (teacher names redacted). As far as I can tell, I could use the reshape package to calculate the aggregate values, but I'd need to do that a number of times and somehow get all of the data in the correct order. At that point, I should just be doing it in Excel. Does anyone have any suggestions or package recommendations? Thank you!
(EDIT) The data starts as a list of students, their teacher, school, and growth. This data is then aggregated to get a list of teachers with their average class growth. Please note the teachers are then grouped by school. The largest problem I foresee doing this with R as of now is how do you get the subtotal and total rows (BSA1 Total, Grand Total, etc) in there since they are not the same type of observation as the others? Do you just manually have to calculate them and try to get them in the correct order so they appear at the bottom of that group?

(source: imgh.us)


