46

I'm looking for a tool that will render a RDF graph in a reasonably useful graphic format. The primary purpose of the graphic format being inclusion into a PowerPoint slide or printing on a large plotter for management review.

I am currently using TopBraid Composer which does a reasonably well at visualizing a single entity but doesn't seem to have a clear way of visualizing the entire graph (as a whole).

Anyone know of any good solutions to this problem?

TopBraid Composer Graph view screenshot

Glorfindel
  • 21,988
  • 13
  • 81
  • 109
Eric Schoonover
  • 47,184
  • 49
  • 157
  • 202

9 Answers9

17

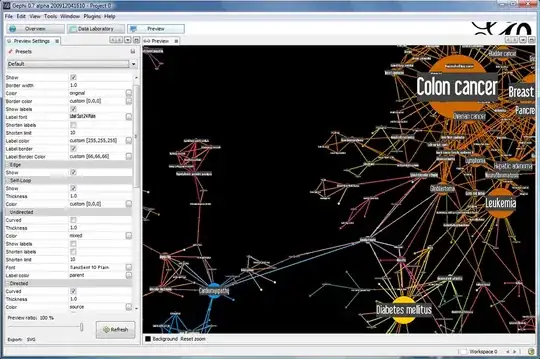
Gephi was already mentioned, but I'll incode screenshots and a short description here.

Gephi can not just visualize graphs but also supports analyzing, layouting and further importing and exporting. There is a Semantic Web Import Extension that allows you to directly query (via SPARQL) or import RDF data. https://wiki.gephi.org/index.php/SemanticWebImport (You can install it directly within the program at Plugins.

Gephi Screenshot

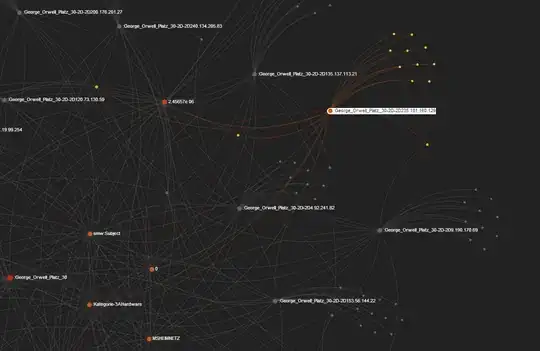
There's a JavaScript Graph Visualisation Library which worked quiet nice for me: http://sigmajs.org/ It works well together with Gephi since you can Export your graph from there and import the file into SigmaJS. That way you can export your graph to an interactive web site. Example: http://fannon.de/p/smw/vis/George_Orwell_Platz_30.html

enter image description here

An important mention would be D3.js which has already dozends of force graph examples. But it doesn't support RDF directly, so the data has to be converted first.

A nice one is this: http://nylen.tv/d3-process-map/graph.php?dataset=les-mis

enter image description here

Fannon
  • 383
  • 3
  • 14
16

RDF Gravity is an RDF visualisation tool.

Here's a screenshot: RDF Gravity Screenshot
(source: salzburgresearch.at)

Glorfindel
  • 21,988
  • 13
  • 81
  • 109
Seb Rose
  • 3,628
  • 18
  • 29
  • 1
    Website is currently down. Screenshot https://web.archive.org/web/20161121211502im_/http://semweb.salzburgresearch.at/apps/rdf-gravity/html/owl_ontology_1.jpg and download https://web.archive.org/web/20161208093431/http://semweb.salzburgresearch.at:80/apps/rdf-gravity/download.html – RADXack Feb 21 '18 at 17:24
9

I was looking for one too and i found this : https://gephi.org/ Pretty sure it works with rdf.

P.Nichols
  • 193
  • 1
  • 2
  • 9
  • 1
    Gephi has a Semantic Web Extension which lets you query or import RDF directly. It also has a lot of graph layouting and analyzing capabilities. This makes Gephi my current favorite. – Fannon May 28 '14 at 08:21
  • It only allows for .rdf and .rdfs files. Not .ttl or .nq. Moreover, https:// endpoint don't seem supported. – Richard Oct 27 '17 at 08:31
  • 1
    Version 0.10 does not support SemanticWebExtension plugin. Old versions like does. – Peter Feb 20 '23 at 13:41
8

-Cytoscape http://www.cytoscape.org/ works well with large scale graphs and you can create a static pdf or image.

-I also found this very interesting http://d3js.org/

It's not specific to RDF graphs, but in the examples there seems to be some cool functionality where the users could have a large degree of interaction with the data. It does however require a fair amount of JS programming knowledge.

C.Neal
  • 319
  • 3
  • 12
8

WebVOWL is a great choice for visualizing ontologies. http://vowl.visualdataweb.org/webvowl.html

enter image description here

Good Lux
  • 896
  • 9
  • 19
8

Protégé. Activate Tools > Tabs > Jambalaya.

alt text
(source: utexas.edu)

Glorfindel
  • 21,988
  • 13
  • 81
  • 109
  • Thanks gizmo, but I did specifically request screen shots. You could have gotten some reputation by posting a link to protege and a screenshot. It's less for me than it is for others that are coming to view this post in the future. – Eric Schoonover Sep 20 '08 at 03:01
  • Maybe this is what you are looking for: http://www.ischool.utexas.edu/~i385t-sw/archive/protege/protege-jambalaya-02.png – Lena Schimmel Jan 29 '09 at 14:43
5

RDFShape which is also based on Graphviz can be useful to visualize small RDF graphs for presentations. It allows both SVG and PNG output formats. An example visualization can be this one

Labra
  • 1,412
  • 1
  • 13
  • 33
  • 1
    Thanks, unfortunately it does not seem very well maintained or explained. For your example visualisation, I'm getting `Error response from https://api.rdfshape.weso.es/api/data/info: Error: Network Error`. – alelom Jan 24 '22 at 11:56
  • You may be right that in the past it was not well maintained, however, we have been working in the last months in a new version and now it is more stable. You can try again and we will appreciate any feedback or suggestion. – Labra Mar 15 '22 at 15:08
3

The Perl utility rdfdot, based on Graphviz, and this library, might help:

http://metacpan.org/pod/RDF::Trine::Exporter::GraphViz

https://github.com/nichtich/RDF-Trine-Exporter-GraphViz

Graphviz is able to handle thousands of nodes, and therefore might suit the scale of your problem..

remi.chateauneu
  • 109
  • 2
  • 9
  • This can no longer be installed on Linux/Ubuntu. Pre-installation test fails: `t/serialize.t : Failed test 'edges' ... $got->[0] = 'Z -> node1 [label="skos:narrower",' ... $expected->[0] = 'Z -> node1 [label="skos:narrower", style=bold];' Looks like you failed 1 test of 4.` – knb May 25 '22 at 08:57
  • Indeed this CPAN module has not been updated for many years, but that specific testsuite failure [seems just harmless whitespace changes](https://github.com/nichtich/RDF-Trine-Exporter-GraphViz/issues/3) - try suppress testsuite errors while installing the module, e.g. with `cpanm --force ...` – Jonas Jun 08 '22 at 09:52
2

Commandline with rapper and graphviz:

$ rapper --input ntriples $fname.nt --output dot > $fname.dot $ dot -Tpng $fname.dot > $fname.png

dr0i
  • 2,380
  • 2
  • 19
  • 36