I'm trying to make a nested boxplot like in this SO-answer for matplotlib, but I have trouble figuring out how to create my dataframe.
Goal of this is to make some kind of sensitivity analysis of a PCA model representing object positions (in 3D); where I can see how well a PCA model is able to represent an arch-like distribution, based on the number of PCA components I'm using.
So I have an array of shape (n_pca_components, n_samples, n_objects) containing the distances of the objects to their 'ideal' position on an arch. What I am able to boxplot is this (example showing random data):
 This is - I assume - an aggregated boxplot (statistics gathered over the first two axes of my array); I want to create a boxplot with the same x- and y-axes, but for each 'obj_..' I want a boxplot for each value along the first axis of my data (
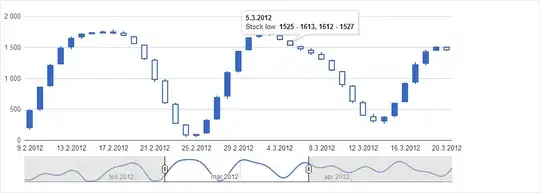
n_pca_components), i.e. something like this (where days correspond to 'obj_i's, 'total_bill' to my stored distances and 'smoker' to each entry along the first axis of my array.
I read around but got lost in the concepts of panda's multi-indexing, groupby, (un)stack, reset_index, ... All examples I see have a different data structure and I think that's where the problem lies, I haven't yet made the mental 'click' and am thinking in wrong data structures.
What I have so far is this (using random/example data):
n_pca_components = 5  # Let's say I want to make this analysis for using 3, 6, 9, 12, 15 PCA components
n_objects = 14   # 14 objects per sample
n_samples = 100  # 100 samples

# Create random data
mses = np.random.rand(n_pca_components, n_samples, n_objects)   # Simulated errors

# Create column names
n_comps = [f'{(i+1) * 3}' for i in range(n_pca_components)]
object_ids = [f'obj_{i}' for i in range(n_objects)]
samples = [f'sample_{i}' for i in range(n_samples)]

# Create panda dataframe
mses_pd = mses.reshape(-1, 14)
midx = pd.MultiIndex.from_product([n_comps, samples], names=['n_comps', 'samples'])

mses_frame = pd.DataFrame(data=mses_pd, index=midx, columns=object_ids)

# Make a nested boxplot with `object_ids` on the 'large' X-axis and `n_comps` on each 'nested' X-axis; and the box-statistics about the mses stored in `mses_frame` on the y-axis.

# Things I tried (yes, I'm a complete pandas-newbie). I've been reading a lot of SO-posts and documentation but cannot seem to figure out how to do what I want.
sns.boxplot(data=mses_frame, hue='n_comps')  # ValueError: Cannot use `hue` without `x` and `y`
sns.boxplot(data=mses_frame, hue='n_comps', x='object_ids') # ValueError: Could not interpret input 'object_ids'
sns.boxplot(data=mses_frame, hue='n_comps', x=object_ids) # ValueError: Could not interpret input 'n_comps'
sns.boxplot(data=mses_frame, hue=n_comps, x=object_ids) # ValueError: The truth value of a Series is ambiguous. Use a.empty, a.bool(), a.item(), a.any() or a.all().

