1

I´ve got the following code:

ggplot(dummy$Crustacean) +
  geom_rect(
    aes(
      xmin = char2num(sites_fct) - 0.4,
      xmax = char2num(sites_fct) + 0.4,
      ymin = ifelse(trophic == "Crustacean", 0.01, 1),
      ymax = summed_tu),
    colour = 'black', alpha =0.7) +
  labs(y= expression("Summed TU"[EC10-QSAR]), x= "Sampling sites")+
  scale_y_log10(limits = c(0.0001, 1)) +
  # Fake discrete axis
  scale_x_continuous(labels = sort(unique(dummy$Crustacean$sites_fct)), breaks = 1:9) +
  # before the dot means vertical plotting
  facet_grid(dummy$Crustacean$metrics_fct ~ dummy$Crustacean$trophic) +
  theme_bw()+
  # facet_grid box colour
  theme(strip.background.x = element_rect(colour = "black", fill = "white"),
        strip.background.y = element_blank(), strip.text.y = element_blank())+
  theme(axis.text.x  = element_text(size=10, margin =margin(0,0,0,0), angle =45, vjust = 1, hjust=1),
        axis.title.y = element_blank(),
        axis.text.y  = element_blank(),
        axis.line.x  = element_line(color = 'black', size=0.5),
        axis.line.y  = element_blank())

which give as uutput the following figure:

enter image description here

I need to change the colour of those boxes y > 0.01 in order to have this desire output:

enter image description here

I found several post about background (quite useful for the future) but I cloud not find something like my example.

Thanks!

Pedr Nton
  • 79
  • 7
  • Could you please paste your data into the question as an object using `dput(dummy$Crustacean)` so that solutions can be tested and verified? – Peter Mar 31 '21 at 16:26
  • OP - Looks like you're trying to make a column/bar chart. It will probably be way easier to use `geom_col` instead of `geom_rect`. You only have to supply a discrete x aesthetic and a y aesthetic. – chemdork123 Mar 31 '21 at 16:31
  • @Peter it has more than 2000 characters... I cannot copy as comment – Pedr Nton Mar 31 '21 at 18:00
  • @chemdork123 You are right, but the full figure is more complex and when I used `geom_col` I dont get what I exactly need. – Pedr Nton Mar 31 '21 at 18:02

1 Answers1

3

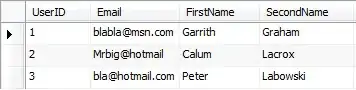
OP, this should probably help you. You're trying to draw what appears to be a column or bar chart. In this case, it's probably best to use geom_col instead of geom_rect. With geom_col you only have to supply an x aesthetic (discrete value), and a y aesthetic for the height of the bar. You have not shared your data, but it seems the x axis is categorical already in your dataset, right?

Here's a reprex:

library(ggplot2)

set.seed(1234)
df <- data.frame(x=LETTERS, y=rnorm(26))

ggplot(df, aes(x,y)) +
  geom_col(
    aes(fill=ifelse(y>0, 'positive', 'negative')),
    color='black', alpha=0.8
  ) +
  scale_fill_manual(name='Value', values=c('positive'='orange', 'negative'='gray'))

enter image description here

What's going on here is that we only have to supply x and y to get the bars in the correct place and set the height. For the fill of each of the bars, you can actually just set the label to be "positive" or "negative" (or whatever your desired label would be) on the fly via an ifelse statement. Doing this alone will result in creating a legend automatically with fill colors chosen automatically. To fix a particular set of colors, I'm setting that manually via scale_fill_manual() and supplying a named vector to the values argument.

In your case, you can probably do something similar for geom_rect. That is, you could just try specifying fill= inside aes() and following a similar manner to here if you want... but I'd recommend switching to use geom_col, as it is most appropriate for what you're doing.

EDIT

As OP indicated in the comment, in the original question on which this is based, geom_rect is required since the bars minimum is not always the same number. The ymin aesthetic changes, so it makes sense to use geom_rect here.

The brute force way is to still use ifelse statements inside aes() for fill. It get's a bit dodgey, but it gets the job done:

ggplot(df) +
  geom_rect(
    aes(
      xmin = char2num(sites) - 0.4,
      xmax = char2num(sites) + 0.4,
      ymin = ifelse(trop == "pt", 0.1, 1),
      ymax = conc,
      fill = ifelse(trop == "pt",
                ifelse(conc > 0.1, 'positive', 'negative'),
                ifelse(conc > 1, 'positive', 'negative'))
    ),
    colour = 'black', alpha = 0.8
  ) +
  scale_y_log10() +
  # Fake discrete axis
  scale_x_continuous(labels = sort(unique(df$sites)),
                     breaks = 1:3) +
  scale_fill_manual(name='Conc', values=c('positive'='orange', 'negative'='gray')) +
  facet_grid(. ~ trop) +
  theme_bw()

enter image description here

To complete the setup, you may want to adjust the order of the items in the legend and avoid some of that kind of icky nested ifelse stuff. In that case, you can always do the checking outside the ggplot call. If you have more than the two values for df$trop, you can consider creating the df$conc_min column via a merge with another dataset, but it works just fine here.

df$conc_adjust <- char2num(df$sites)
df$conc_min <- ifelse(df$trop=='pt', 0.1, 1)
df$status <- ifelse(df$conc > df$conc_min, 'positive', 'negative')

# levels of the factor = the order appearing in the legend
df$status <- factor(df$status, levels=c('positive', 'negative'))

ggplot(df) +
  geom_rect(
    aes(
      xmin = conc_adjust - 0.4,
      xmax = conc_adjust + 0.4,
      ymin = conc_min,
      ymax = conc,
      fill = status
    ),
    colour = 'black', alpha = 0.8
  ) +
  scale_y_log10() +
  # Fake discrete axis
  scale_x_continuous(labels = sort(unique(df$sites)),
                     breaks = 1:3) +
  scale_fill_manual(name='Conc', values=c('positive'='orange', 'negative'='gray')) +
  facet_grid(. ~ trop) +
  theme_bw()

enter image description here

chemdork123
  • 12,369
  • 2
  • 16
  • 32
  • Here is the reason why I do not use `geom_col` [https://stackoverflow.com/questions/66387471/manipulate-scale-y-log-in-geom-bar-ggplot2] This is the full figure (https://ibb.co/2MXpMpw) – Pedr Nton Mar 31 '21 at 18:04
  • you can realise that it has different log breaks in the y-axis, they dont start at 0 – Pedr Nton Mar 31 '21 at 18:10
  • OK - @PedrNton, I've made an edit based on your original question and which uses `geom_rect`. You have some options there. – chemdork123 Mar 31 '21 at 20:03
  • Excellent! extremely useful. Thanks for your help. @chemdork123 – Pedr Nton Apr 01 '21 at 06:30
  • Of course. Like I mention in the answer, if your actual case has many facets (different `df$trop` values), I would suggest making a separate data frame that includes a `trop` column and a `conc_min` column, then doing a `left_join()` or another merge with your `df` dataset by the `trop` column to map the `conc_min` column... .better than a billion nested `ifelse()` statements! – chemdork123 Apr 01 '21 at 15:16