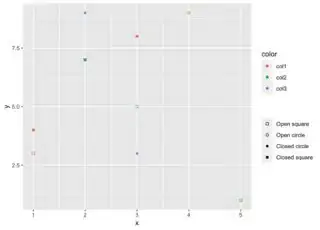
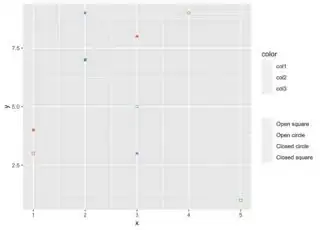
I am trying to do something similar as in panel B of this figure: https://ars.els-cdn.com/content/image/1-s2.0-S0002929721000938-gr3_lrg.jpg, where I use shape as a legend, and closed or open shape as a second legend.
I use the following example data
example_data <- data.frame(x=c(1,3,2,4,5,3,1,2,3,2),
                           y=c(3,5,7,9,1,3,4,7,8,9),
                           color=c('col1','col2','col3','col1','col2','col3','col1','col2','col1','col3'),
                           shape=c('triangle','circle','triangle','circle','triangle','circle','triangle','circle','triangle','circle'),
                           openclosed=c('open','open','open','open','open','closed','closed','closed','closed','closed'))
I manage to make a plot with the different shapes and open/closed dependent on the columns with
example_data$point_shape <- -1
example_data[example_data$shape=='triangle' & example_data$openclosed=='closed',]$point_shape <- 15
example_data[example_data$shape=='triangle' & example_data$openclosed=='open',]$point_shape <- 0
example_data[example_data$shape=='circle' & example_data$openclosed=='closed',]$point_shape <- 16
example_data[example_data$shape=='circle' & example_data$openclosed=='open',]$point_shape <- 1
example_data$point_shape <- as.character(example_data$point_shape)


ggplot(example_data, aes(x, y, colour=color, shape=point_shape))+
  geom_point()+
  scale_shape_manual(name='', breaks=unique(example_data$point_shape),
                     values=as.numeric(unique(example_data$point_shape)),
                     labels=c('Open square','Open circle',
                              'Closed circle','Closed square'))
I then tried https://stackoverflow.com/a/44725969/651779 to get two shape legends with
ggplot(example_data, aes(x, y, colour=color, shape=point_shape))+
  geom_point(show.legend=F)+
  geom_point(data = example_data[example_data$shape %in% c('triangle','circle'),],
             size=0,alpha=0)+
  geom_point(data = example_data[example_data$openclosed %in% c('open','closed'),],
             size=0, alpha=0)+
  scale_shape_manual(name='', breaks=unique(example_data$point_shape),
                     values=as.numeric(unique(example_data$point_shape)),
                     labels=c('Open square','Open circle',
                              'Closed circle','Closed square'))+
    guides(alpha = guide_legend(title = "Shape", order = 1,
                                override.aes = list(shape = c(15,16),
                                                    size = 5, color = "black",alpha=1)),
           size = guide_legend(title = "Open or closed", order = 2,
                               override.aes = list(shape = c(16,1),
                                                   size = 5, color = "black", alpha=1)))
But this didnd't add the two separate legends.
How can I change the legend to have 1 legend with a square/circle, and another legend with open/closed shape?


