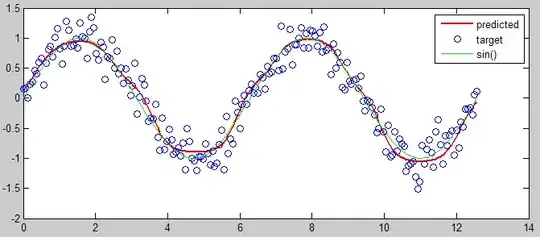
I'm trying to add a legend to this
timeseries and rename each y in the legend. I did some research and I couldn't find an example that fit my case. Each geom_ correspond to a column in my df_07 (containing only integers).
here is my code:
gg07 <-
  ggplot(df_07) +
  geom_line(aes(x = datetime, y = pred_pm25_monitor_humidity), color = "blue") +
  geom_line(aes(x = datetime, y = pm25_monitor), linetype = "dashed") +
  geom_point(aes(x = datetime, y = pm25 ), shape = 1) +
  ylab("PM2.5 (µg/m3)") +
  xlab("Date") +
  ggtitle("Raw and Fitted Monitor Data -- July 01-08, 2020")
I'm trying to create a legend that looks like this:
"blue line" Fitted monitor PM25
"dashed line" Monitor PM25
"empty circle" Sensor PM25
Thank you so much!
