Adding to @nico-schlömer and @mseifert 's answers, I computed the performance of a numba-test has_nan with early stops, compared to some of the functions that will parse the full array.
On my machine, for an array without nans, the break-even happens for ~10^4 elements.
import perfplot
import numpy as np
import numba
import math

def min(a):
    return np.isnan(np.min(a))

def dot(a):
    return np.isnan(np.dot(a, a))

def einsum(a):
    return np.isnan(np.einsum("i->", a))

@numba.njit
def has_nan(a):
    for i in range(a.size - 1):
        if math.isnan(a[i]):
            return True
    return False


def array_with_missing_values(n, p):
    """ Return array of size n,  p : nans ( % of array length )
    Ex : n=1e6, p=1 : 1e4 nan assigned at random positions """
    a = np.random.rand(n)
    p = np.random.randint(0, len(a), int(p*len(a)/100))
    a[p] = np.nan
    return a


#%%
perfplot.show(
    setup=lambda n: array_with_missing_values(n, 0),
    kernels=[min, dot, has_nan],
    n_range=[2 ** k for k in range(20)],
    logx=True,
    logy=True,
    xlabel="len(a)",
)
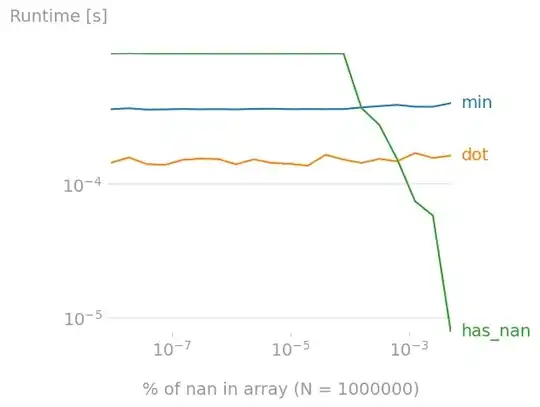
What happens if the array has nans ? I investigated the impact of the nan-coverage of the array.
For arrays of length 1,000,000, has_nan becomes a better option is there are ~10^-3 % nans (so ~10 nans) in the array.
#%%
N = 1000000  # 100000
perfplot.show(
    setup=lambda p: array_with_missing_values(N, p),
    kernels=[min, dot, has_nan],
    n_range=np.array([2 ** k for k in range(20)]) / 2**20 * 0.01,
    logy=True,
    xlabel=f"% of nan in array (N = {N})",
)
If in your application most arrays have nan and you're looking for ones without, then has_nan is the best approach.
Else; dot seems to be the best option.


