Using matplotlib you could do something like:
image = np.random.randint(low=0, high=255, size=(10, 10))

fig, ax = plt.subplots()
ax.imshow(image, cmap='gray')

for i in range(image.shape[0]):
    for j in range(image.shape[1]):
        ax.text(j, i, str(image[i, j]), color='r', ha='center', va='center')
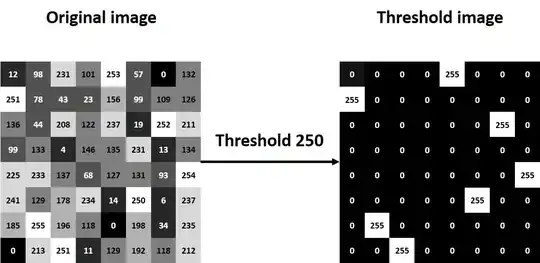
It will produce the following image:

By the way, if you want to stick to grayscale only, you might want to try something like:
for i in range(image.shape[0]):
    for j in range(image.shape[1]):
        c = 1 if image[i, j] < 128 else 0
        ax.text(j, i, str(image[i, j]), color=(c, c, c), ha='center', va='center')
        ax.axis("off")
Resulting in: