EDIT ----
After chatting with OP I've revised the code to include a step probability. This may result in the walk being stationary much more frequently. In higher dimensions, you will need to scale your prob factor lower in order to compensate for more options.
finally, my function does not account for an absolute distance, it only considers points on the grid that are within a certain step size in all dimensions. For example, hypothetically, at position c(0,0) you could go to c(1,1) with this function. But I guess this is relative to the grid's connectiveness.
If the OP wants to only consider nodes that are within 1 (by distance) of the current position, then use the following version of move_step()
move_step <- function(cur_pos, grid, prob = 0.04, size = 1){
  opts <- grid %>%
    rowwise() %>%
    mutate(across(.fns = ~(.x-.env$cur_pos[[cur_column()]])^2,
                  .names = '{.col}_square_diff')) %>%
    filter(sqrt(sum(c_across(ends_with("_square_diff"))))<=.env$size) %>%
    select(-ends_with("_square_diff")) %>%
    left_join(y = mutate(cur_pos, current = TRUE), by = names(grid))
  new_pos <- opts %>%
    mutate(weight = case_when(current ~ 1-(prob*(n()-1)), #calculate chance to move,
                              TRUE ~ prob),               #in higher dimensions, we may have more places to move
           weight = if_else(weight<0, 0, weight)) %>%    #thus depending on prob, we may always move.
    sample_n(size = 1, weight = weight) %>%
    select(-weight, -current)
  new_pos
}
library(dplyr)
#>
#> Attaching package: 'dplyr'
#> The following objects are masked from 'package:stats':
#>
#> filter, lag
#> The following objects are masked from 'package:base':
#>
#> intersect, setdiff, setequal, union
library(ggplot2)
library(gganimate)
move_step <- function(cur_pos, grid, prob = 0.04, size = 1){
opts <- grid %>%
filter(across(.fns = ~ between(.x, .env$cur_pos[[cur_column()]]-.env$size, .env$cur_pos[[cur_column()]]+.env$size))) %>%
left_join(y = mutate(cur_pos, current = TRUE), by = names(grid))
new_pos <- opts %>%
mutate(weight = case_when(current ~ 1-(prob*(n()-1)), #calculate chance to move,
TRUE ~ prob), #in higher dimensions, we may have more places to move
weight = if_else(weight<0, 0, weight)) %>% #thus depending on prob, we may always move.
sample_n(size = 1, weight = weight) %>%
select(-weight, -current)
new_pos
}
sim_walk <- function(cur_pos, grid, grid_prob = 0.04, steps = 50, size = 1){
iterations <- cur_pos
for(i in seq_len(steps)){
cur_pos <- move_step(cur_pos, grid, prob = grid_prob, size = size)
iterations <- bind_rows(iterations, cur_pos)
}
iterations$i <- 1:nrow(iterations)
iterations
}
origin <- data.frame(x = 0, y =0)
small_grid <- expand.grid(x = -1:1, y = -1:1)
small_walk <- sim_walk(cur_pos = origin,
grid = small_grid)
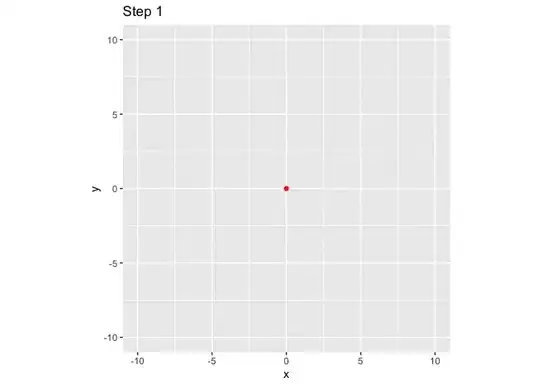
ggplot(small_walk, aes(x, y)) +
geom_path() +
geom_point(color = "red") +
transition_reveal(i) +
labs(title = "Step {frame_along}") +
coord_fixed()
large_grid <- expand.grid(x = -10:10, y = -10:10)
large_walk <- sim_walk(cur_pos = origin,
                       grid = large_grid,
                       steps = 100)

ggplot(large_walk, aes(x,y)) +
  geom_path() +
  geom_point(color = "red") +
  transition_reveal(i)  +
  labs(title = "Step {frame_along}") +
  xlim(c(-10,10)) + ylim(c(-10,10))+
  coord_fixed()
large_walk %>%
  count(x, y) %>%
  right_join(y = expand.grid(x = -10:10, y = -10:10), by = c("x","y")) %>%
  mutate(n = if_else(is.na(n), 0L, n)) %>%
  ggplot(aes(x,y)) +
  geom_tile(aes(fill = n)) +
  coord_fixed()
multi_dim_walk <- sim_walk(cur_pos = data.frame(x = 0, y = 0, z = 0),
                           grid =  expand.grid(x = -20:20, y = -20:20, z = -20:20),
                           steps = 100, size = 2)

library(cowplot)
plot_grid(
  ggplot(multi_dim_walk, aes(x, y)) + geom_path(),
  ggplot(multi_dim_walk, aes(x, z)) + geom_path(),
  ggplot(multi_dim_walk, aes(y, z)) + geom_path())
Created on 2021-05-06 by the reprex package (v1.0.0)

