I have the following code:
library(GGally)
group <- c("b", "c", "d", "c", "d", "b", "d", "c", "b", "c", "d", "c", "d", "b", "d", "c")
one <- c(123, 174, 154, 143, 184, 134, 165, 192, 123, 174, 154, 143, 184, 134, 165, 192)
two <- c(223, 274, 254, 243, 284, 234, 265, 292, 223, 274, 254, 243, 284, 234, 265, 292)
three <- c(323, 374, 354, 343, 384, 334, 365, 392, 323, 374, 354, 343, 384, 334, 365, 392)
four <- c(423, 474, 454, 443, 484, 434, 465, 492, 423, 474, 454, 443, 484, 434, 465, 492)
df <- data.frame(group, one, two, three, four)
p <- df %>% ggpairs(.,
                    mapping = ggplot2::aes(colour=group),
                    lower = list(continuous = wrap("smooth")),
                    diag = list(continuous = wrap("blankDiag"))
)
getPlot(p, 1, 5) + guides(fill=FALSE)
plots = list()
for (i in 1:5){
  plots <- c(plots, lapply(2:p$ncol, function(j) getPlot(p, i = i, j = j)))
}
p <- ggmatrix(plots,
              nrow = 5,
              ncol=p$ncol-1,
              xAxisLabels = p$xAxisLabels[2:p$ncol],
              yAxisLabels = p$yAxisLabels,
)
p
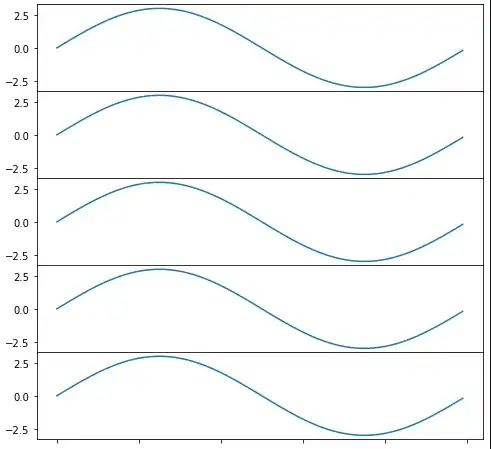
This is the output.
 I want the groups to be shown in a different order. I can do this by replacing the strings in the group column of the dataframe:
df$group = str_replace_all(df$group,"b","2-b")
df$group = str_replace_all(df$group,"c","1-c")
df$group = str_replace_all(df$group,"d","3-d")
That puts things in the order I want, but the labels become "1-c", "2-b", "3-d" because I've changed some of the values. Is it possible to replace "1-c", "2-b", "3-d" with "c", "b", "d" respectively in the plot, while retaining the new order? Or is there another solution?


