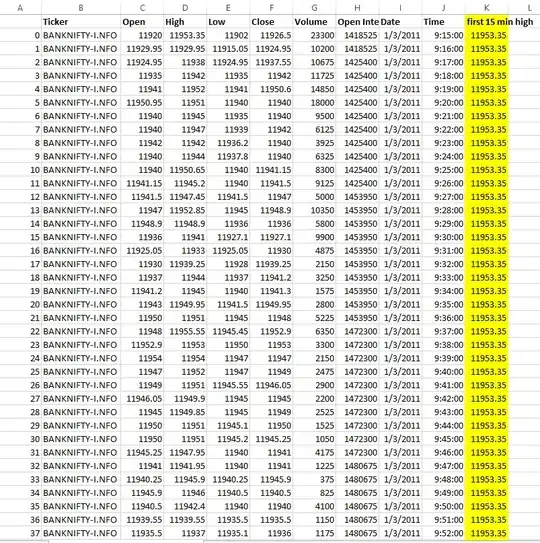
The data you present is maintained in excel, but I will answer on the assumption that pandas is available. As a sample data, get the data from Yahoo Finance and first create the first five data frames grouped by year, month, and day. Group the created data frame by date and find the maximum value. Combine the data frame for which the maximum value was obtained with the original data frame. If you're looking for a quick answer, posting the data in text and providing the code you're working on is a must.
import pandas as pd
import yfinance as yf
df = yf.download("AAPL", interval='1m', start="2021-05-18", end="2021-05-25")
df.index = pd.to_datetime(df.index)
df.index = df.index.tz_localize(None)
df['date'] = df.index.date
# first 5 records by day
first_15min = df.groupby([df.index.year,df.index.month,df.index.day])['High'].head(15).to_frame()
# max value
first_15min = first_15min.groupby([first_15min.index.date]).max()
df.merge(first_15min, left_on='date', right_on=first_15min.index, how='inner')

    Open    High_x  Low     Close   Adj Close   Volume  date    High_y
0   125.980003  126.099998  125.970001  126.065002  126.065002  0   2021-05-17  126.099998
1   126.060097  126.070000  125.900002  125.910004  125.910004  135988  2021-05-17  126.099998
2   125.900002  125.900002  125.790298  125.880096  125.880096  172001  2021-05-17  126.099998
3   125.889999  125.889999  125.790001  125.860001  125.860001  81338   2021-05-17  126.099998
4   125.870003  125.968201  125.870003  125.919998  125.919998  187059  2021-05-17  126.099998
...     ...     ...     ...     ...     ...     ...     ...     ...
1942    127.490097  127.557404  127.480003  127.540001  127.540001  161355  2021-05-24  126.419998
1943    127.540001  127.559998  127.480003  127.485001  127.485001  143420  2021-05-24  126.419998
1944    127.485001  127.529999  127.449997  127.480003  127.480003  132487  2021-05-24  126.419998
1945    127.479897  127.500000  127.449997  127.470001  127.470001  98478   2021-05-24  126.419998
1946    127.480003  127.550003  127.460098  127.532303  127.532303  128118  2021-05-24  126.419998
