6

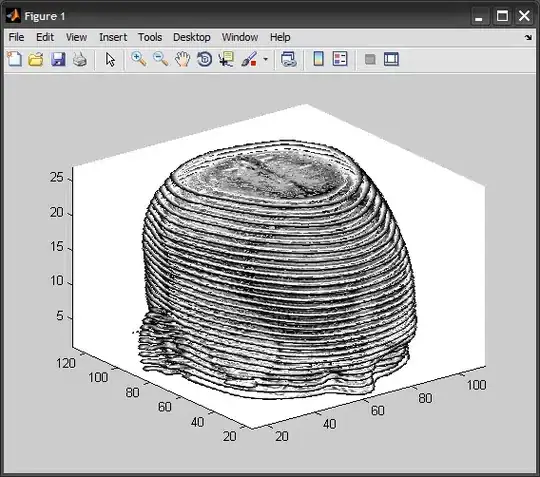
I have a set of 100 2-D image slices of the same size. I have used MATLAB to stack them to create a volumetric data. While the size of the 2-D slices is 480x488 pixels, the direction in which the images are stacked is not wide enough to visualize the volume in different orientation when projected. I need to interpolate along the slices to increase the size for visualization.

Can somebody please give me an idea or tip about how to do it?

Edit: Anotated projected microscopy-images

Looking at a face

General view

The figure 1 is the top-view of the projected volume.

The figure 2 is the side-view of the projected volume.

When I change the rotation-angle, and try to visualize the volume in different orientation, e.g. side-view (figure 2), is what I see as in figure 2.

I want to expand the side view by interpolating along the image slices.

Sequentialrant
  • 83
  • 1
  • 1
  • 8

3 Answers3

4

Here is an adapted example from the MATLAB documentation on how to visualize volumetric data (similar to yours) using isosurfaces:

%# load MRI dataset: 27 slices of 128x128 images
load mri
D = squeeze(D);       %# 27 2D-images

%# view slices as countours
contourslice(D,[],[],1:size(D,3))
colormap(map), view(3), axis tight

%# apply isosurface
figure
%#D = smooth3(D);
p = patch( isosurface(D,5) );
isonormals(D, p);
set(p, 'FaceColor',[1,.75,.65], 'EdgeColor','none')
daspect([1 1 .5]), view(3), axis tight, axis vis3d
camlight, lighting gouraud

%# add isocaps
patch(isocaps(D,5), 'FaceColor','interp', 'EdgeColor','none');
colormap(map)

contourslice isosurface_isocaps

Amro
  • 123,847
  • 25
  • 243
  • 454
3

MATLAB has a function interp3 that can be used for interpolation, assuming that the data is uniformly discretised.

Check out the documentation.

Hope this helps.

EDIT: The MATLAB function interp3 works as follows:

vi = interp3(x, y, z, v, xi, yi, zi);

I assume that your "stack" of slices defines the arrays x, y, z, v as 3D arrays, where x, y are the coordinates of the pixels in the plane, z is the "height" of each slice and v is the actual image slices, maybe as "intensity" values for the pixels.

If you want to interpolate new image slices at intermediate z values you could specify these levels in the zi array. The arrays xi, yi would again represent the coordinates of the pixels in the plane.

Darren Engwirda
  • 6,915
  • 4
  • 26
  • 42
  • Thanks for the suggestion, Darren. I am basically trying to add slices between slices. I could not understand what you mean by "uniformly discretized" data. I am fairly new to this. Can you please help me understand by elaborating it. – Sequentialrant Jul 21 '11 at 08:26
  • 1
    See my edit for a bit more info. If this doesn't help, maybe post a few more details about your problem. A "uniform discretisation" in this case means that the data is structured according to a Cartesian grid (as opposed to a scattered triangulation for example) - I'm fairly confident that your problem is uniform. – Darren Engwirda Jul 21 '11 at 10:53
  • +1 as @DarrenEngwirda explained, 2D image slices have uniform grid locations (pixel locations and slice height). If for some reason that's not the case, you can use `griddata3`/`TriScatteredInterp` to interpolate scattered data... – Amro Jul 21 '11 at 15:33
  • Darren, and Amro, thanks for explaining about "uniform discretization". Regarding interpolation, I am at sixes and sevens. I am working on visualization of microscopy-images. I have edited my post by annotationg some projected images. Hoping to get some suggestions and help. – Sequentialrant Jul 23 '11 at 10:19
  • Hello Darren. I am still not able to figure it out. Can you help me understand a bit more about using interp3 for this particular application? – Sequentialrant Aug 01 '11 at 10:37
0

I created a function to interpolate along image slices. Below is the code:

    function res = interp_along_slices( vol, scale )
    % Interpolation along the image slices

    % Get the size of the volume
      [r c p] = size(vol);

    % Pre-allocate the array:
    % the third dimension is scale times the p
      vol_interp = zeros(r,c,scale*p);

    % interpolate along the image slices 
      for inr = 1:r;
          for jnr = 1:c;
              xi = vol(inr,jnr,:);
              vol_interp(inr,jnr,:) = interp(xi, scale); 
          end;
      end;

      res = vol_interp;

    end
Sequentialrant
  • 83
  • 1
  • 1
  • 8