0

I want to create an user defined function to eliminate code redundancies/repetition.

I want to plot multiple plots like this for multiple col2 (which has several levels) and GROUP by GROUP column.

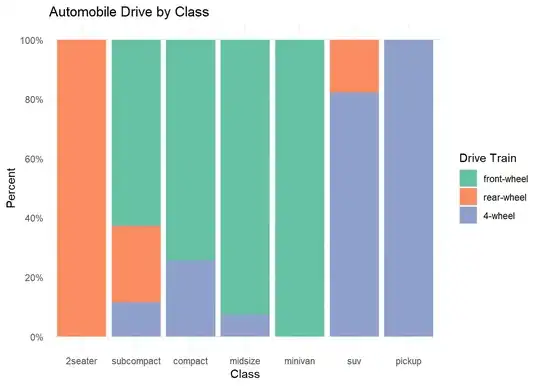
Sample images of the desired plots:

https://i.stack.imgur.com/BmkhZ.png

https://rkabacoff.github.io/datavis/datavis_files/figure-html/fancyfillbar-1.png

fn.colplot <- function(data, col2, GROUP) {
dt_PCT <- data[, .N, by = .(col2, GROUP)]
dt_PCT[, PCT := round(100*N/sum(N)), by = .(GROUP)]
dt_plot <- ggplot(dt_PCT, aes(GROUP, PCT, fill = factor(col2))) +
geom_col(position = "fill") + 
geom_text(aes(label = paste0(PCT,"%")), position = position_fill(vjust = 0.5))
return(dt_plot)
}

When I run it with my data return an error that col2 is not found while DISTRIBUTORS column exists in my data.

Error in eval(bysub, x, parent.frame()) : object 'DISTRIBUTORS' not found

May I ask some one know how to call the column names after by = inside a function defined by user like this?

If I bring the script out and plug in real names of columns, it worked well.

Thanks all for your advice, I have solved the problem by calling the function with specific arguments like this fn.colplot(data = dt_all, col2 = "DISTRIBUTORS", GROUP = "GROUP") . I could run the function smoothly and plot a lot of plots. Thank you @RonakShah

1darknight
  • 83
  • 8
  • 1
    Your chances of help will increase significantly, if you could give some toy_data in reproducible format which can be copied and code tried upon. – AnilGoyal May 28 '21 at 05:00
  • Suggested duplicate: [How to use a variable to specify a column name in `ggplot2`](https://stackoverflow.com/a/55524126/903061). Don't pay attention to the top answer with `aes_string`, which is quite dated, instead use the `.data` or the `!!` methods mentioned in other answers. – Gregor Thomas May 28 '21 at 05:31

1 Answers1

0

Pass the column names as string and do these changes in the function.

library(data.table)
library(ggplot2)

fn.colplot <- function(data, col2, GROUP) {
  dt_PCT <- dt[, .N, c(col2, GROUP)]
  dt_PCT[, PCT := round(100*N/sum(N)), by = .(GROUP)]

  dt_plot <- ggplot(dt_PCT, aes(.data[[GROUP]], PCT, 
                   fill = factor(.data[[col2]]))) +
    geom_col(position = "fill") + 
    geom_text(aes(label = paste0(PCT,"%")), 
              position = position_fill(vjust = 0.5))
  return(dt_plot)
}

fn.colplot(dt, 'col2', 'group')
Ronak Shah
  • 377,200
  • 20
  • 156
  • 213
  • Thank you! I tried your code but the problem persists. I think my problem in the code is the part `dt_PCT <- data[, .N, by = .(col2, GROUP)]` where the column is not found in my data using by. Do you think so? – 1darknight May 28 '21 at 06:52
  • 1
    I didn't realise that `by` works with string values only when there is one column. For more than one column we need to use `mget`. See my updated answer. – Ronak Shah May 28 '21 at 06:57
  • I encountered `Error: value for ‘1’ not found Called from: (function (x) stop(gettextf("value for %s not found", sQuote(x)), call. = FALSE))("1")` Do I need to specify values for `ifnotfound`? – 1darknight May 28 '21 at 07:39
  • 1
    by character works for multiple columns specified by single character vector, so instead of `.()` you combine those variables with `c()`. – jangorecki May 28 '21 at 09:46
  • @1darknight Please provide a reproducible example to help you further. – Ronak Shah May 28 '21 at 10:00
  • @jangorecki thanks, I did not know that. That is useful to know. – Ronak Shah May 28 '21 at 10:00
  • Thanks all for your advice, I have solved the problem by calling the function with specific arguments like this `fn.colplot(data = dt_all, col2 = "DISTRIBUTORS", GROUP = "GROUP")` . I could run the function smoothly and plot a lot of plots. Thank you @RonakShah and @jangorecki – 1darknight May 30 '21 at 13:35