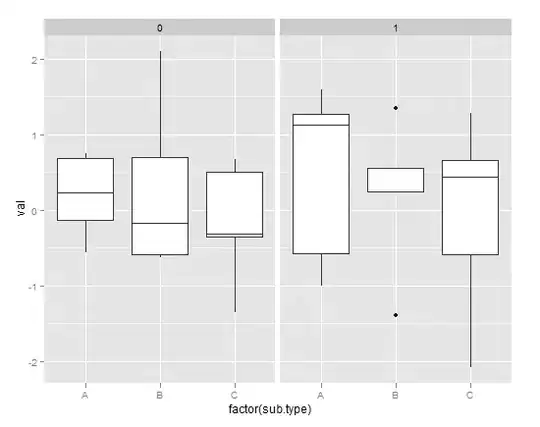
Let's say I have two data sets, one with y-range [min0:max0] and the other with y-range [min1:max1]. How can put both box plots in one plot next to each other with a sane y-range [min(min0, min1):max(max0, max1)]?
Here's what I tried:
d0 <- matrix(rnorm(15), ncol=3)
d1 <- matrix(rnorm(15), ncol=3)

par(mfrow = c(1, 2))
boxplot(d0)
usr <- par("usr")
plot.new()
par(usr = usr)
boxplot(d1, add = TRUE)
But that will only keep the first plots y-range and also squeeze both plots whereas I'd like them to be square.
Any ideas?