Doing more research someone pointed me to a GitHub page where the product team posted a PowerShell script to find part of what I was looking for {1}. So I did some modifications to the script to have the output that I needed. With the output below I can extract the values from the MS calculator to get an estimated cost for each pipeline run. {2}
$startTime = "21/6/2021 7:00:00"
$endTime = "21/6/2021 10:00:00"
$adf = '<data factory name>'
$rg = '<resrouce group name>'


$outputObj = @()
$pipelineRuns = Get-AzDataFactoryV2PipelineRun -ResourceGroupName $rg -DataFactoryName $adf -LastUpdatedAfter $startTime -LastUpdatedBefore $endTime

# loop through all pipelines and child activities to return billable information
foreach ($pipelineRun in $pipelineRuns) {
    $activtiyRuns = Get-AzDataFactoryV2ActivityRun -ResourceGroupName $rg -DataFactoryName $adf -pipelineRunId $pipelineRun.RunId -RunStartedAfter $startTime -RunStartedBefore $endTime

    foreach ($activtiyRun in $activtiyRuns) {
        if ($null -ne $activtiyRun.Output -and $null -ne $activtiyRun.Output.SelectToken("billingReference.billableDuration")) {

            $obj = @()
            $obj = $activtiyRun.Output.SelectToken("billingReference.billableDuration").ToString() | ConvertFrom-Json
            $obj | Add-Member -MemberType NoteProperty -Name activityType -value $activtiyRun.Output.SelectToken("billingReference.activityType").ToString()
            $obj | Add-Member -MemberType NoteProperty -Name pipelineName -value $pipelineRun.PipelineName
            $obj | Add-Member -MemberType NoteProperty -Name activtiyRuns -value $activtiyRuns.Count

            $outputObj += $obj
        }
        else {}
    }
}

# output aggregated result set as table
$groupedObj = $outputObj | Group-Object -Property pipelineName, activityType, meterType
$groupedObj | ForEach-Object {
    $value = $_.name -split ', '
    New-Object psobject -Property @{

        activityType              = $value[1];
        meterType                 = $value[2];
        pipelineName              = $value[0];
        executionHours            = [math]::Round(($_.Group | Measure-object -Property duration -sum).Sum, 4)
        orchestrationActivityRuns = $groupedObj.group.activtiyRuns[0]
    }
} | Sort-Object -Property meterType | Format-Table
Output sample:
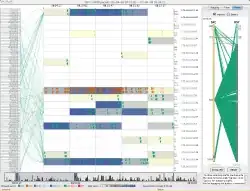
Consumption report from the Data Factory monitor
reference:
- https://github.com/Azure/Azure-DataFactory/tree/main/SamplesV2/PastRunDetails#simple-script-that-prints--activity-level-run-details-in-45-day-range {1}
- https://azure.microsoft.com/en-us/pricing/calculator/?service=data-factory%2F {2}


