0

I think the best way to illustrate what Im looking for is through this example. I want to convert a DataFrame that looks like this:

Table 1

Table 1

Ideally, into this where the counts of each code are represented in the columns:

Table 2

Table 2

If that can't be done, then I'm wondering if it'd be possible just to have a table of dummy variables like this:

Table 3
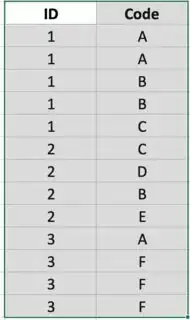
Table 3

Henry Ecker
  • 34,399
  • 18
  • 41
  • 57

1 Answers1

1

One way: use pivot_table(to get the 2nd table) and then use clip (to get the 3rd table) if required.

df = pd.DataFrame({
    'ID': [1, 1, 1, 1, 1, 1, 1, 1, 2, 2, 2, 2, 2, 3, 3, 3],
    'Code': ['A', 'B', 'C', 'D', 'E', 'F', 'A', 'B', 'C', 'D', 'E', 'F', 'A', 'B', 'C', 'D']})
df = df.reset_index().pivot_table(index='ID', columns='Code', values='index',
                             aggfunc='count', fill_value=0).clip(upper=1)
Nk03
  • 14,699
  • 2
  • 8
  • 22