0

How can I change the y-axis values to show the full number of digits?

import seaborn as sns
sns.boxplot (x="waterfront", y="price", data=df)

I wanted the full range of digits to show (as in screenshot "target"), but the boxplot I created shows an annotated one (as in screenshot "current").

Target:
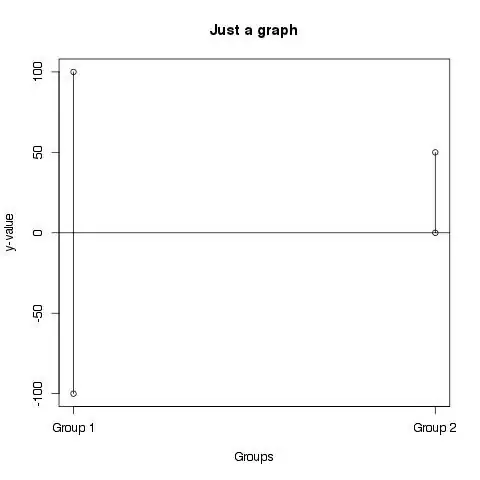
Target scale

Current:

Current scale

tripleee
  • 175,061
  • 34
  • 275
  • 318
  • 1
    Please show the code that you have done the figures with. In addition, your question does not state what python library you are using for creating the box plot. :) – Heikura Jun 29 '21 at 07:37
  • import seaborn as sns sns.boxplot (x="waterfront", y="price", data=df) – moon light Jun 29 '21 at 07:49

1 Answers1

0

See answer from here: Seaborn / Matplotlib: How to repress scientific notation in factorplot y-axis

This is the code you need:

import seaborn as sns
import matplotlib.pyplot as plt

sns.boxplot (x="waterfront", y="price", data=df)
plt.ticklabel_format(style='plain', axis='y',useOffset=False)

example picture

Heikura
  • 1,009
  • 3
  • 13
  • 27