16

I have two sets of points with error bars. I would like to offset the second so it's displayed slightly down from the first set, so that it doesn't obscure the original.

Here is a mock data set:

x=runif(4,-2,2)
y=c("A","B","C","D")
upper=x+2
lower=x-2
x_1=runif(4,-1,3)
upper_1=x_1+1
lower_1=x_1-2

Here is the code that I used to produce the plot:
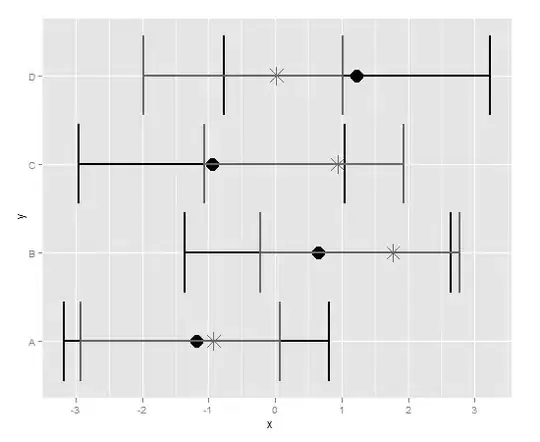
qplot(x,y)+
  geom_point(size=6)+
  geom_errorbarh(aes(xmax=upper,xmin=lower),size=1)+
  geom_point(aes(x_1,y),size=6,pch=8,vjust=-1,col="grey40")+
  geom_errorbarh(aes(xmax=upper_1,xmin=lower_1),size=1,col="grey40")

And here is the plot:

scatterplot

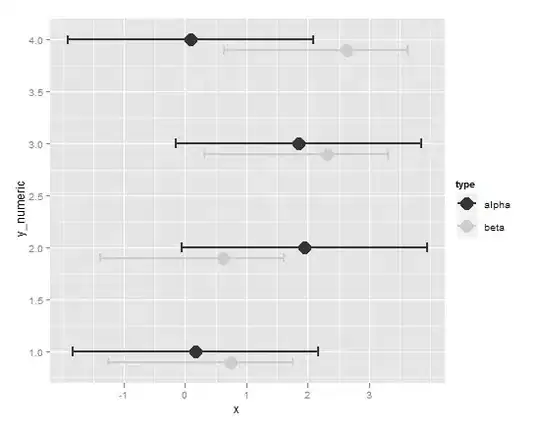
I would like the grey asterisks and associated errors bars to be plotted a hair below the black circles and associated error bars. I would transform the data set, but the Y-axis is categorical variables.

Paul Hiemstra
  • 59,984
  • 12
  • 142
  • 149
jslefche
  • 4,379
  • 7
  • 39
  • 50

4 Answers4

23

Using Richie's reorganization of your data, this is also possible purely within ggplot, without having to mess with the axis:

dodge <- position_dodge(width=0.5)  
p <- ggplot(dfr,aes(x=y,y=x,colour=type)) + 
        geom_point(aes(shape=type),position=dodge) +
        geom_errorbar(aes(ymax=upper,ymin=lower),position = dodge) + 
        scale_colour_manual(values = c('gray','black')) +
        scale_shape_manual(values = c(8,19)) +
        coord_flip() + 
        opts(legend.position="none")

which gives me this plot:

enter image description here

Note: Since version 0.9.2 opts has been replaced by theme:

+ theme(legend.position = "none")
joran
  • 169,992
  • 32
  • 429
  • 468
  • Sorry, not familiar with the the scale_shape_manual and coord_flip arguments, but qplot is kicking back an error: Non-numeric argument to binary operator – jslefche Jul 25 '11 at 19:29
  • @jslefche - You're probably introducing an error in trying to translate this solution to `qplot`. Learn to use `ggplot()`, it will pay dividends. – joran Jul 25 '11 at 19:33
  • Ahh, I see what you did there with coord_flip(). Very nice. Works great with `ggplot()`. Marked as answered. – jslefche Jul 25 '11 at 19:43
  • I know this question is old, but I need a little more help. I would like to have one symbol be an open circle (pch=21) but not have the error bar show THROUGH the symbol. Haven't been able to get this with scale_fill_manual. Any thoughts? – jslefche Aug 02 '11 at 16:12
  • I can't think of anything off the top of my head. I think this might make a good SO question on its own, though. – joran Aug 02 '11 at 16:56
10

Reorganise your data into a data frame.

x = runif(4,-2,2)
x_1 = runif(4,-1,3)
dfr <- data.frame(
  x = c(x, x_1),
  y = rep(c("A","B","C","D"), 2),
  upper = c(x+2, x_1+1),
  lower = c(x-2, x_1-2),
  type = rep(c("alpha", "beta"), each = 4)
)

Add a column that is a numeric version of the factor y.

dfr$y_numeric <- with(dfr, 
  as.numeric(y) - ifelse(type == "alpha", 0, 0.1)
)

           x y    upper       lower  type y_numeric
1 0.16694617 A 2.166946 -1.83305383 alpha       1.0
2 1.95060734 B 3.950607 -0.04939266 alpha       2.0
3 1.85516860 C 3.855169 -0.14483140 alpha       3.0
4 0.08773196 D 2.087732 -1.91226804 alpha       4.0
5 0.74837995 A 1.748380 -1.25162005  beta       0.9
6 0.61489655 B 1.614897 -1.38510345  beta       1.9
7 2.31641418 C 3.316414  0.31641418  beta       2.9
8 2.62842027 D 3.628420  0.62842027  beta       3.9

Now your plotting code is simpler.

ggplot(dfr, aes(x, y_numeric, colour = type)) +
  geom_point(size = 6) +
  geom_errorbarh(aes(xmax = upper,xmin = lower), size = 1) +
  scale_colour_grey()

final image with staggered plots

Ari B. Friedman
  • 71,271
  • 35
  • 175
  • 235
Richie Cotton
  • 118,240
  • 47
  • 247
  • 360
3

In most recent ggplot2, you can set the desired dodge width to match the width of the error bar tails using position = position_dodge(width = #):

set.seed(45)
data <- data.frame(group = c(rep("Z", 4), rep("Y", 4)),
                   value = runif(8),
                   x = rep(c("a","b","c","d"),2))

data$ll <- data$value - abs(runif(8))
data$ul <- data$value + abs(runif(8))


ggplot(data = data, aes(x = x, y = value, color = group)) +
  geom_point(size = 2, position = position_dodge(width = 0.2)) + 
  geom_hline(yintercept = 1, linetype = "dotted") +
  geom_errorbar(aes(ymin = ll, ymax = ul), width = 0.2, position = "dodge")

enter image description here

1

Jared Lander has a fantastic script up on github that creates a new function, position_dodgev, for horizontal error bars.

It's here: https://github.com/jaredlander/coefplot/blob/master/R/position.r

And I found it through his original post, which has an older version that doesn't currently work with my install of ggplot2: http://www.jaredlander.com/2013/02/vertical-dodging-in-ggplot2/

You can use his function as you would position_dodge with geom_errorbar, e.g.,

... + geom_errorbarh(aes(xmin = LowInner, 
    xmax = HighInner), height = 0.5, lwd = 1, position = position_dodgev(height = 0.8))

This solution worked for me, as I'm faceting the plot and didn't want to mess around with creating a new column in the data.frame.

Nova
  • 5,423
  • 2
  • 42
  • 62