In R, I have a data frame that is based on an IPUMS CPS extract in which I'd like to tabulate households based on residents' education level. In the df, each observation is a specific person. There exists a variable called "CPSID" which is a unique household identifier. That being said, all observations with the same value in the CPSID column live in the same household. For example, if three separate observations have the same value in the CPSID column, that means those three observations live in a household together. I've used ifelse statements to identify each observation's education level using the "Education" variable.
Now, I'd like to do two things:
- I want to add a new column that displays the total amount of people in a specific observation's household WITHOUT collapsing the data by a certain group. So, if three observations have the same CPSID, then "3" should be displayed in the new column for each of those observations sharing the CPSID.
- Right now I have a "1" indicating the education level attained and a "0" otherwise. Instead, I'd like that number to again display the total number of people in the household. For example, if an observation lives with three people, then I want a "3" to show up in the area that identifies the education level.
The screenshot of the R Studio df is what I currently have
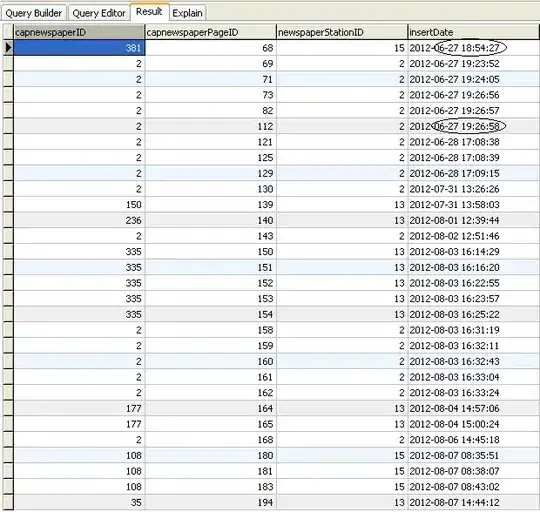 .
.
The screenshot of the excel is an example of what it should look like
 .
.
If anyone could help me out, that would be spectacular! Thanks a ton in advance.
Education_status <- data.frame(data3$YEAR, data3$MONTH, data3$CPSID, data3$HWTFINL, data3$EDUC99)
Education_status <- filter(Education_status, data3.EDUC99 !=0)
Education_status["less than Associate's"] <- ifelse(Education_status$data3.EDUC99 <= 11, 1, 0)
Education_status["Associate's"] <-
 ifelse(Education_status$data3.EDUC99 == 12, 1, 0) +
 ifelse(Education_status$data3.EDUC99 == 13, 1, 0) +
 ifelse(Education_status$data3.EDUC99 == 14, 1, 0)
Education_status["Bachelor's"] <- ifelse(Education_status$data3.EDUC99 == 15, 1, 0)
Education_status["more than Bachelor's"] <- ifelse(Education_status$data3.EDUC99  15, 1, 0)

colnames(Education_status) <- c("Year", "Month", "CPSID", "Weight",
 "Education", "less than Associate's", "Associate's", "Bachelor's",
 "more than Bachelor's")

Edu_example <- dput(Education_status[1:10,])
Edu_Ex <-   structure(
     list(
       Year = c(2019, 2019, 2019, 2019, 2019, 2019, 2019,
                2019, 2019, 2019),
       Month = structure(
         c(1L, 1L, 1L, 1L, 1L, 1L,
           1L, 1L, 1L, 1L),
         labels = structure(
           1:12,
           .Names = c(
             "January",
             "February",
             "March",
             "April",
             "May",
             "June",
             "July",
             "August",
             "September",
             "October",
             "November",
             "December"
           )
         ),
         label = "Month",
         var_desc = "MONTH indicates the calendar month of the CPS interview.",
         class = c("haven_labelled",
                   "vctrs_vctr", "integer")
       ),
       CPSID = c(
         20181200000100,
         20181200000100,
         20171200000300,
         20171200000300,
         20190100000500,
         20190100000500,
         20171200000500,
         20181000000200,
         20171000000400,
         20171000000400
       ),
       Weight = c(
         1821.1212,
         1821.1212,
         1804.2193,
         1804.2193,
         3296.9061,
         3296.9061,
         2296.3113,
         2673.3924,
         1733.4595,
         1733.4595
       ),
       Education = structure(
         c(9L,
           11L, 11L, 10L, 13L, 10L, 11L, 11L, 11L, 7L),
         labels = c(
           NIU = 0L,
           `No school completed` = 1L,
           `1st-4th grade` = 4L,
           `5th-8th grade` = 5L,
           `9th grade` = 6L,
           `10th grade` = 7L,
           `11th grade` = 8L,
           `12th grade, no diploma` = 9L,
           `High school graduate, or GED` = 10L,
           `Some college, no degree` = 11L,
           `Associate degree, type of program not specified` = 12L,
           `Associate degree, occupational program` = 13L,
           `Associate degree, academic program` = 14L,
           `Bachelors degree` = 15L,
           `Masters degree` = 16L,
           `Professional degree` = 17L,
           `Doctorate degree` = 18L
         ),
         label = "Educational attainment, 1990",
         var_desc = "EDUC99 reports the respondent's highest level of educational attainment. Respondents without high school diplomas were
 to indicate the highest school grade they had completed, while those
 with high school diplomas were to indicate the highest diploma or
 degree they had obtained.",
         class = c("haven_labelled",
                   "vctrs_vctr", "integer")
       ),
       `less than Associate's` = c(1, 1,
                                   1, 1, 0, 1, 1, 1, 1, 1),
       `Associate's` = c(0, 0, 0, 0, 1, 0,
                         0, 0, 0, 0),
       `Bachelor's` = c(0, 0, 0, 0, 0, 0, 0, 0, 0, 0),
       `more than Bachelor's` = c(0, 0, 0, 0, 0, 0, 0, 0, 0, 0)
     ),
     row.names = c(NA,
                   10L),
     class = "data.frame"   )