I have a problem which I try to solve with mathematica.
I am having a list with x and y coordinates from a position measurement (and also with z values of the quantity which was measured at each point). So, my list starts with
list={{-762.369,109.998,0.915951},{-772.412,109.993,0.923894},{-777.39, 109.998, 0.918108},...} (x,y,z).
Out of some reasons, I have to fill all these x,y, and z-values into a matrix. That would be easy if I have for each y-coordinate the same amount of x-coordinates (lets say 80), then I could use Partition[list,80] which produces a matrix with 80 columns (and some rows whose number is given by the number of y-coordinates with the same value).
Unfortunately, it is not so easy, the number of x-coordinates for each y is not strictly constant, as can be seen from the attached ListPlot.
 Can anybody give me some suggestions, how I could fill each point of this plot / each x-y-(and z-) coordinate of my list into a matrix?
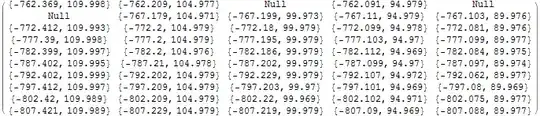
To explain better what I want to have, I indicated in the attached picture a matrix. There one can see that almost every point of my plot would fall into a cell of a matrix, only some cells would stay empty. I used in the plot the color red for the points whose x coordinates are ascending in my list and blue for the points whose x coordinate are descending in my list (the positions are measured along a meander line). Perhaps this kind of order can be useful to solve to problem... Here a link to my coordinates, perhaps this helps.
Well, I hope I explained my question well enough. I would appreciate every help much!