13

This question concerns memory in Android.

My method:

I have two activites, A and B. From A, I launch B like this:

Intent i = new Intent(A.this, B.class);
startActivity(i);

On button click in B, I do this:

B.this.finish();
  • In B, I override the onDestroy method and set all references to null.
  • I do not allocate new memory in the onResume method of A.
  • I am not leaking a context.
  • I am not using multiple threads.
  • I am not using services.
  • All variables in B are private class variables, and all of them are set to null in the onDestroy of B.
  • Also, ImageViews in B have their background set null in the onDestroy of B.
  • I am certain that B gets destroyed.

The result:

When I am in Activity A, heap memory is at 7.44 MB. Then when I start B and call finish on B(and thus returning to A), heap is increased by 0.16 MB. Repeating this process again, heap is increased by 0.08 MB every time.

  • I'm not looking at the heap limit, I'm looking at the allocated heap.
  • I'm calling System.gc() at the end of the onDestroy method of B.

Additional info:

-I have used MAT to analyse memory allocations and try to find this leak. Something strange is that Activity B seems to have 5 instances. As it so happens, I was repeating the startActivity/finish process 5 times. The bottom entry is the Activity, the others are listeners in the activity:

enter image description here

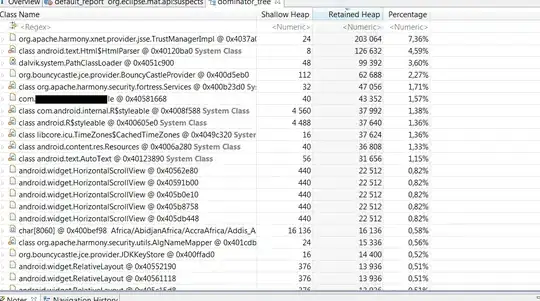
And this is screenshot of the dominator tree. I can't find anything unusual or suspect.

Dominator Tree

-I have watched both google IO videos on memory usage(and leaks).

Question:

Is it possible that this 0.08 MB of heap will always be allocated(and not collectable by the GC) no matter what I do? If not, any idea of what might be causing this?

Update:

  1. I tried to launch activity B without setting a content view in B. This means that B is a completely empty activity. The result was that the heap memory did NOT increase when I'm relaunching the activity several times. Note, however, that this is no solution. I must be able to set a content view.

  2. scorpiodawg: I tried running my app on an emulator, and the heap still grows. Good try though.

  3. ntc: I changed all occurences of "this" to "getApplicationContext()" where it was possible. I could not call setContentView(getApplicationContext()); because setContentView wants a reference to a layout file, not a context. What I did instead was to create an empty layout file and call setContentView(emptylayout); in the onDestroy method of Activity B. That did not help.

  4. I tried to remove all the code so that only setContentView(mylayout) gets called. Problem persisted. Then I removed all the gui elements in the layout XML file. Problem persisted. The only thing that was left was the container views, a couple of nested linear, relative and scrolllayouts. I tried to remove setting the "android:scrollbarDefaultDelayBeforeFade" attribute in the scrollbar. The result was great, the memory leak had vanished. Then I put back all the code I previously removed but didn't set the "android:scrollbarDefaultDelayBeforeFade" attribute and the memory leak was back. How strange is that?

Emir Kuljanin
  • 3,881
  • 1
  • 25
  • 30

5 Answers5

11

If you have 5 instances of activity B, then you are not managing the activity stack correctly. I find the best way to check it is with the CLI command:

adb shell dumpsys meminfo 'your apps package name'

I had a similar problem in a two activity project when I switched between them. Every time I switched I got a new instance on the stack as revealed by the above command. I then set the flags for the launched activities to FLAG_ACTIVITY_REORDER_TO_FRONT with code like:

Intent i = new Intent("com.you.yourActivityB");
i.setFlags(Intent.FLAG_ACTIVITY_REORDER_TO_FRONT);
startActivity(i);

Once I'd done this, then the adb shell command did not show more instances of my two activities when I switched between them

NickT
  • 23,844
  • 11
  • 78
  • 121
  • Setting i.setFlags(Intent.FLAG_ACTIVITY_REORDER_TO_FRONT); on both Activities did the trick! After spending probably 30+ hours on this problem, I cannot thank you enough! – Emir Kuljanin Aug 11 '11 at 20:41
3

Seems that you have a memory leak within that activity.

Probably you are leaking the context (the activity in this case). So ensure that all the references to the context are being cleaned when you call the onDestroy method in the activity. More details here.

Also take a look to possible content observers not being unregistered when you finish the activity.

Nathaniel Ford
  • 20,545
  • 20
  • 91
  • 102
  • Quoting myself: "In B, I override the onDestroy method and set all references to null." and "I am not leaking a context." – Emir Kuljanin Aug 08 '11 at 15:16
  • In the MAT seems like the Activiy is being leaked. I guess that you already followed the path for GC roots using MAT. Also the listeners have any reference to the activity or any member of the activity? As you said, there is a lot of documentation about memory leaking in IO videos etc, but for me, this reference always help: http://grubber.blog.hexun.com/58466974_d.html Cheers. – Francisco Jordano Aug 08 '11 at 15:42
  • I have followed path to GC roots and found nothing suspect. Although I must admit, I'm not quite sure what to look for. At least I can't find any variabels that are mine. As for the MAT screenshot, what makes you think there's a leak? As for the listeners, I tried compiling with no listeners at all in B, and yet the heap increase stays the same. Nothing to do with my listeners. – Emir Kuljanin Aug 08 '11 at 16:42
2

What i think is, its a typical java question. And killing an Activity does't mean that its associated objects should be removed from the heap, even if they are in lost land (their reference are null). because its completely dependent on virtual machine when it calls Garbage collector (Irrespective of you saying System.GC()). so when there the condition is like nearly out of memory it calls it and cleans it(cannot be sure again, may be immediately after their reference becomes null), So i don't think you should be worrying about it.

edited: call setContentView(getApplicationContext);

and where ever you are this keyword to pass a context, change it to this.getApplicationContext()

ngesh
  • 13,398
  • 4
  • 44
  • 60
  • I should be worrying about it because I get an OOM exception when I restart Activity B so many times that the 0.08 MB eventually stack up to exceed the maximum heap limit. GC does not swoop in and save my app when there almost no memory left. – Emir Kuljanin Aug 10 '11 at 15:46
1

Consider using

android:launchMode="singleTask"

in your AndroidManifest.xml. See this.

Nathaniel Ford
  • 20,545
  • 20
  • 91
  • 102
Sofi Software LLC
  • 3,879
  • 1
  • 36
  • 34
0

Is it possible that this 0.08 MB of heap will always be allocated(and not collectable by the >GC) no matter what I do? If not, any idea of what might be causing this?

The 0.08MB of heap, if unused, will be reclaimed when the system considers that it needs it. Garbage Collection does not happen as soon as you call System.gc(), it more like a request for GC to happen as soon as it is possible. There is often a LONG time between an object being allocated and it being removed from memory. The Java Virtual Machine Specification and Java Language Specification specify the lifetime of the object undergoing the following stages:

  1. Created
  2. In use (strongly reachable)
  3. Invisible
  4. Unreachable
  5. Collected
  6. Finalized
  7. Deallocated

Note that when an object is Unreachable, it merely becomes a candidate for garbage collection, as and when it may happen. Even with a small footprint JVM like Dalvik, I don't think an object will undergo the full lifetime in a span of time that short. GC is an expensive operation, so is done only as when its needed.

If you have objects that need to be removed from memory quickly (for some reason), then try WeakReference . Or maybe you could provide some more context as to what you're trying to do, and someone could be able to help you out better that way.

For more info on how GC happens in Java, this is a pretty good article

Archit
  • 887
  • 2
  • 10
  • 19
  • Thanks for the link, useful stuff. However, it leads me to the conclusion that the 0.08 MB never reaches the "Unreachable" state. This is worrying because I am setting all references to null in the onDestroy method of Activity B. So basically, I have no idea of what allocates the 0.08 MB of memory. – Emir Kuljanin Aug 10 '11 at 15:49
  • Your setting a reference to null does not get rid of the object that the reference once held. That 0.08 MB is held by a very large number of things. Right from the intent that created the activity to the context of the activity, and plenty of other things. Is it that you're just tinkering about trying to understand stuff, or do you have some goal in mind that you cannot figure out how to accomplish? Not that I'm saying that memory management is no concern of yours, but in most situations you will never have to worry about it so much. Just open the logcat and see how often GC happens. – Archit Aug 10 '11 at 15:57
  • The 0.08 MB that you are concerned about, may have reached the unreachable state. However, before the objects being removed from memory, there are at least two more states they go through. And as an aside, it is perfectly possible that even in the finalization stage, the object becomes reachable again. – Archit Aug 10 '11 at 16:07
  • Your starting and restarting Activity B again and again is not very good idea to begin with. If it MUST be done, try something like the singleInstance launch mode for the activity, and also make sure you indicate that you'll be handling orientation and keyboard changes yourself. This **should** (not completely sure) ensure that only one instance of your activity is created. – Archit Aug 10 '11 at 16:08